© 2026 InterSystems Corporation, Cambridge, MA. All rights reserved.Privacy & TermsGuaranteeSection 508Contest Terms

covid-19 analytics 

5
2 reviews
0
Awards
777
Views
22
IPM installs
 3
3 2
2
Details
Releases (12)
Reviews (2)
Issues
Articles (1)
Dependencies (3)
analytics for covid-19
What's new in this version
Automatic version update
Covid-19 analytics
Try with https://covid-19.demo.community.intersystems.com/dsw/index.html#!/USER
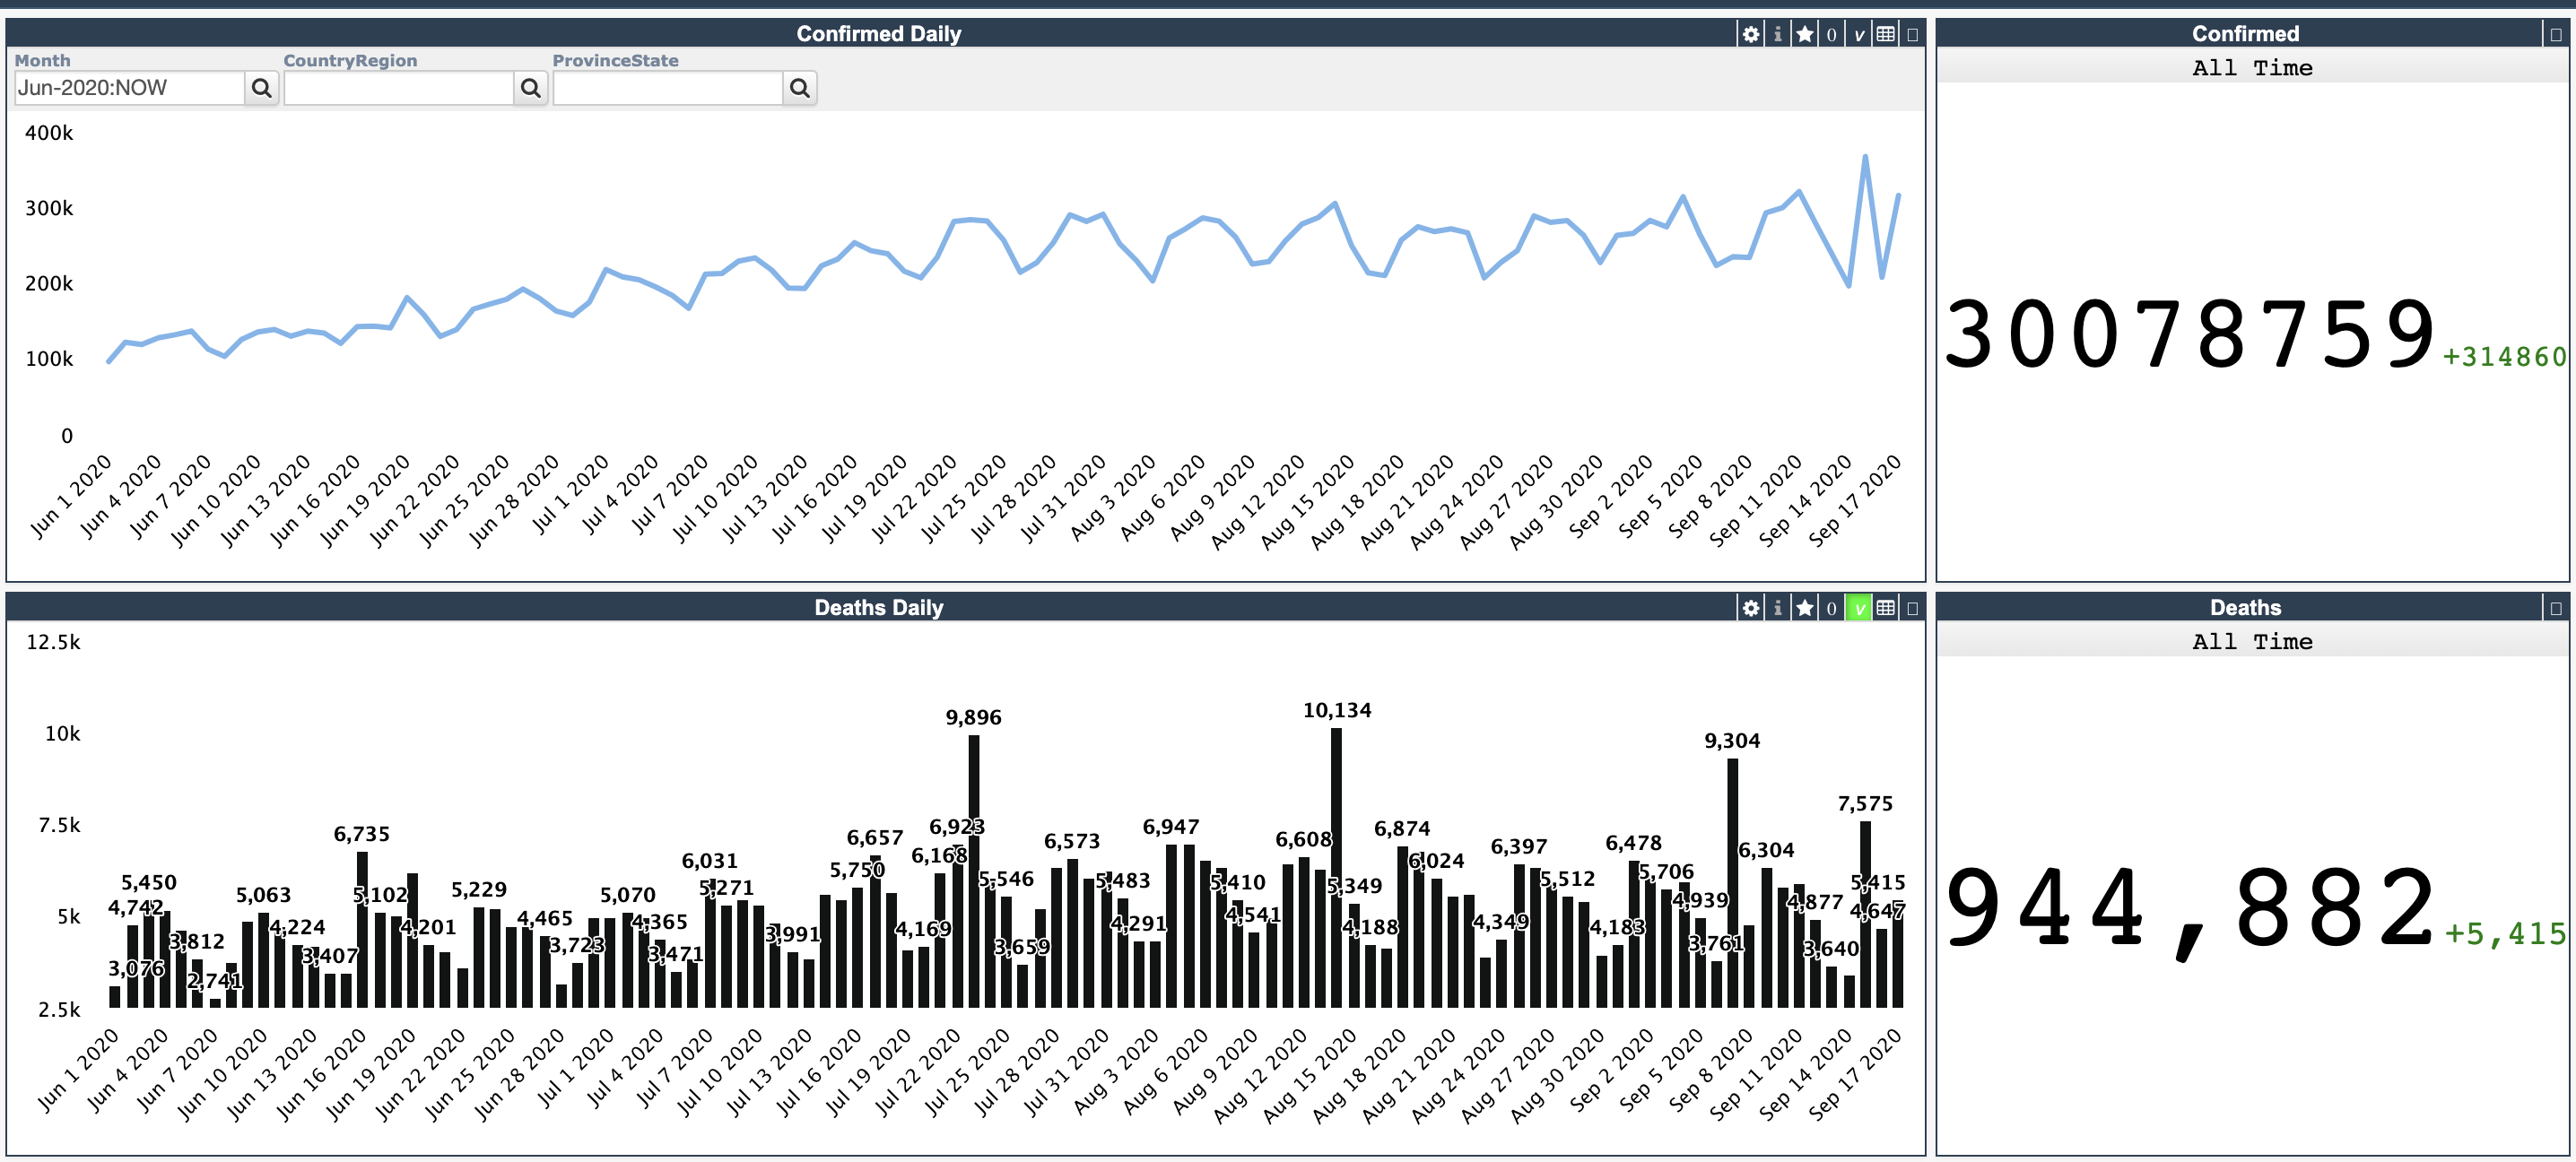
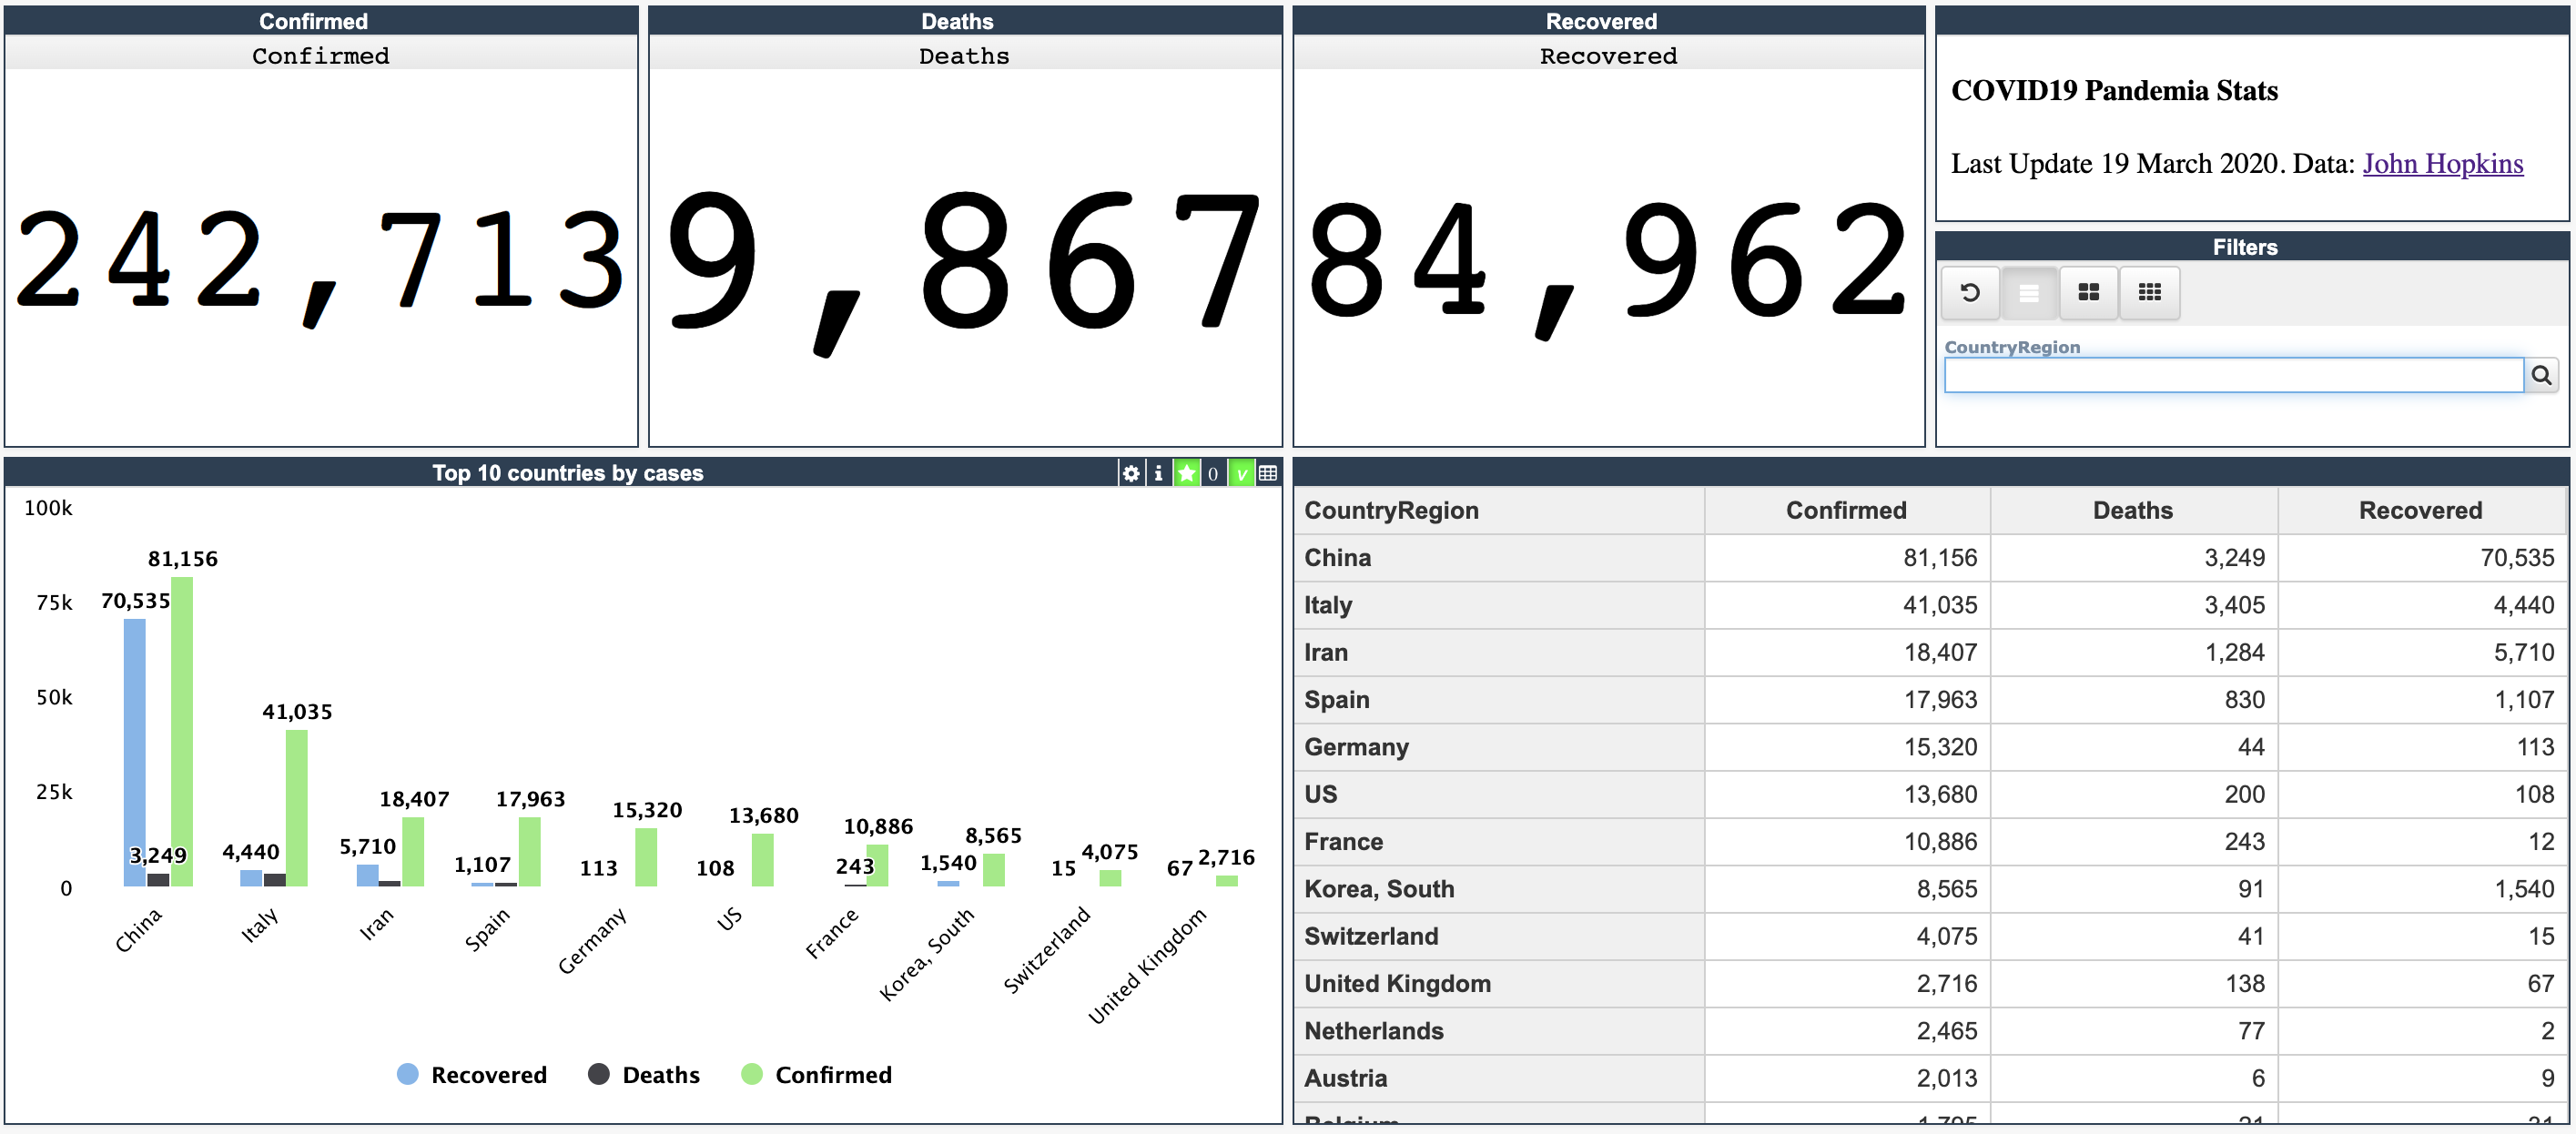
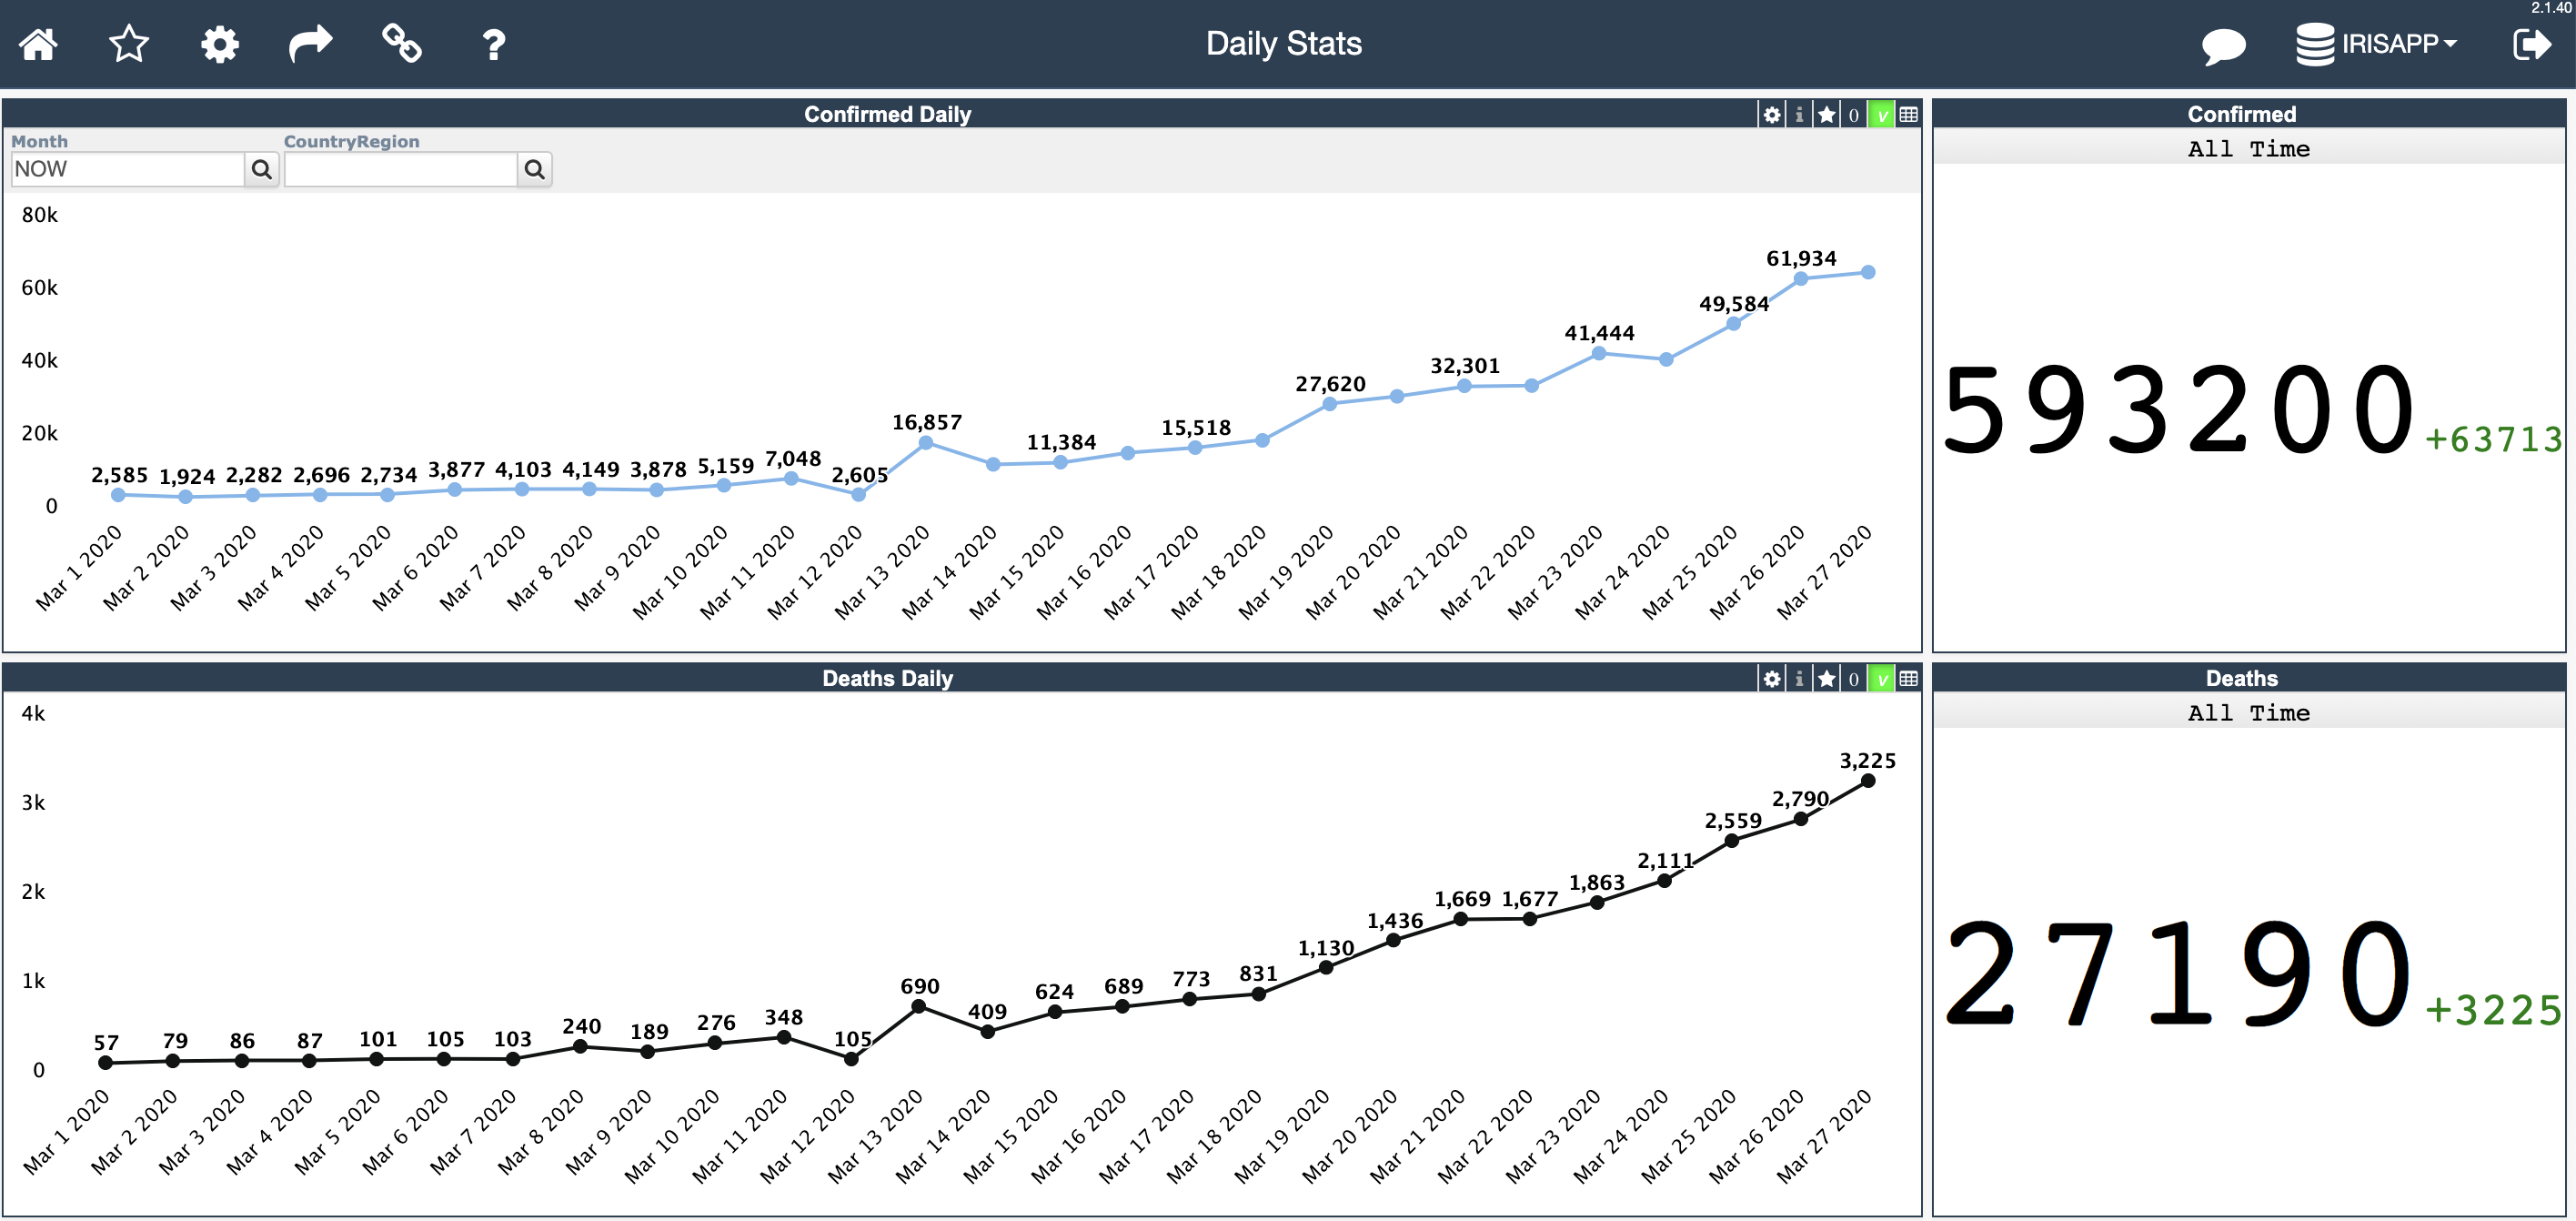
This is an interactive dashboard on the analytics for covid-19 pandemia.

Another dashboard shows the timeline:
There is also USA Interactive map

And the World Map

Also the bubble chart of top 10 countries

data source
The data is taken from Johns Hopkins repo
How it works
The dashboard is running on InterSystems IRIS 2020.4 Community Edition
It uses IRIS Analytics module and DSW as a representation layer
It runs in a Kubernetes cluster in GCP
How it was developed
AnalyzeThis module has been used to generate the class and the cube.
Pivots and Dashboards were built manually using InterSystems IRIS Analytics
DSW is used to design representation layer
ISC-DEV module was used to export pivot and dashboard.
To export changes in Pivots and Dashboards do:
USER> do ##class(dev.code).export("*.DFI")
This will export pivots and dashboards into /src/dfi folder of the repo.
deployment
It’s being deployed by Github Actions using this workflow
Which uses terraform and K8 configuration.
Dockerfile loads sources, pivot and dashboard. It imports data and builds cube.
Installation
Open terminal and clone/git pull the repo into any local directory
$ git clone git@github.com:evshvarov/covid-19.git
Open the terminal in this directory and run:
$ docker-compose build
How to start coding
This repository is ready to code in VSCode with ObjectScript plugin.
Install VSCode, Docker and ObjectScript plugins and open the folder in VSCode.
Right-click on docker-compose.yml file and click Compose Restart
Once docker will finish starting procedure and show:
Creating covid-19_iris_1 ... done
Click on the ObjectScript status bar and select Refresh connection in the menu.
Wait for VSCode to make connection and show something like “localhost:32778[USER] - Connected”
You can start coding after that.
Contributions are welcome via Pull Requests.
Last checked by moderator
29 Nov, 2025WorksMade with
Install
 zpm install evshvarov-covid19-analytics
  download archive
 Version
1.0.725 Mar, 2024
ObjectScript quality test
PassedView reportCategory
Works with
InterSystems IRISInterSystems IRIS for HealthInterSystems IRIS BIFirst published
20 Mar, 2020Last edited
25 Mar, 2024