© 2026 InterSystems Corporation, Cambridge, MA. All rights reserved.Privacy & TermsGuaranteeSection 508Contest Terms

IRIS ESB 

4.5
1 reviews
0
Awards
235
Views
0
IPM installs
 0
0 0
0
Details
Releases (2)
Reviews (1)
Issues
Articles (1)
Enterprise Service Bus (ESB) implementation on InterSystems IRIS Data Platform
What's new in this version
Added more ways for error handling. You can choose a strategy that suits you best. In the Consumer (Broker.Service.InboxReader) added a Read option. The options are responsible for reading the message queue and can contain one of the following values:
NewOnlymeans "At-most once" guarantee type, so the broker will not try to re-deliver failed messages in this threadErrorOnlymeans reading only messages with errors. Use this value to set up a separate error message thread. You can limit the number of message delivery retries by the formula:
RetryCount = MessageLifetime / CallInterval
AllMessages(by default) means "At-least once" guarantee type, the broker will attempt to deliver the message until it receives a successful response, or until the message expires. A single business service handles both types of messages: re-delivery of failed messages and sending new ones
I was surprised that a platform with such a rich integration toolset has no ready-to-use ESB solution. So, this project is a try to implement some typical ESB features:
- Centralize integration code in one place
- Message management (message broker) with guaranteed delivery based on Pub/Sub architecture
- Message validation against the Data Model / Schema
- Flexible API to receive any message types (using payload container)
- Centralized monitoring and alerting control
This project contains three main modules. Let us take a look at them.
Message Broker (Broker.*)
Message Broker is designed to keep messages and create separate message consumers, each of which can be independently subscribed to a message queue. It means all consumers have their own inbound queue by message type (not literally). Messages have statuses: NEW, PENDING (processing in progress), ERROR, and OK (message successfully processed). The main function of this Message Broker is to guarantee the delivery of messages. The message will be resending again and again until one of two events happens: successful message processing or the end of message lifetime (message expired).
IRIS ESB uses a slightly improved version of the Kafka algorithm. Kafka maintains the offset of the last processed message to facilitate moving forward on the message queue. Here, we keep all processed message IDs, which allows us not to stop consuming when we have some "troubled" messages in the queue. So, IRIS ESB can restore data flows after the temporary unavailability (or if we got some "bad data") of external systems without manual actions.
I have not used an external broker, as the same Kafka, for not to lose the coolest IRIS feature - possible to see all that happens with the messages in visual traces. Also, Kafka does not have a message guarantee delivery (usually it is based on retries) out of the box.
How to add data flow in Message Broker?
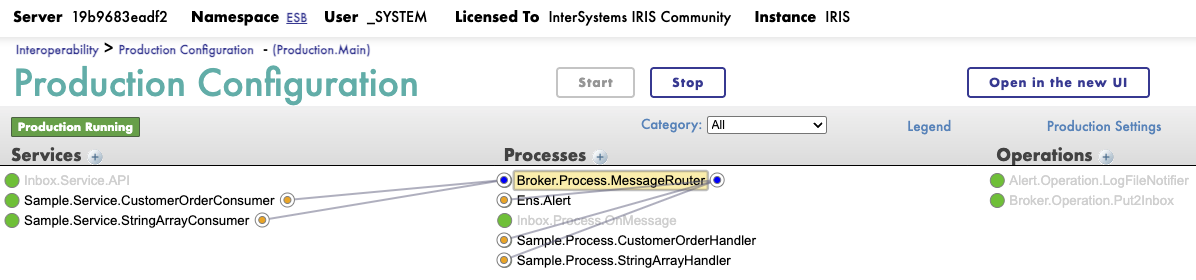
First of all, your Production must have a Broker.Process.MessageRouter business host. He is responsible for routing messages to handlers and setting message statuses. Just add MessageRouter to Production, no need for any additional settings here. It will be common for all data flows.
Next, you need a handler for the message that extends Broker.Process.MessageHandler. It is a place for your custom code for message processing: mapping and transforming to other message formats, sending to external systems via business operations, and so on.
Finally, create a consumer. It is a business service instance of Broker.Service.InboxReader class. It will read messages from the queue and transfer them to the handler. Set up its Settings, where:
MessageHandler- your handler aboveMessageType- on what kind of message we wanna subscribe? It is a full analogy topic in the KafkaMessageLifetime- when the message will expire? Can be different for each consumer
Inbox REST API (Inbox.*)
Each ESB should have a universal way to receive messages from external systems. Here it's a REST API. Universal means you can send any JSON payload to this API. The received JSON text will be deserialized into the Cache class and placed in the Inbox queue. IRIS ESB works with class objects, not %DynamicObject, for example, becouse validation of messages is one more important feature of the ESB pattern. And importing JSON text to the class, I believe, is the best way for it.
So, to add a new custom message type, you need to create a class (or import it from some schema) that extends Inbox.Message.Inbound and describes the structure of your message (see samples in Sample.Message.* package). When you send a message to the Inbox API, set the name of this class as the import_to parameter.
Inbox API testing
There are two endpoints for this API:
GET http://localhost:9092/csp/rest/healthcheck- just a simple healthcheck, should return 200 OK if all set up right wayPOST http://localhost:9092/csp/rest/v1/inbox- put new message into ESB
To put into the ESB a new sample of "Customer Order", you need to do the following request via CURL or Postman:
curl --location 'http://localhost:9092/csp/rest/v1/inbox?import_to=Sample.Message.CustomerOrder.Order' \
--header 'Content-Type: application/json' \
--data '{
    "CreatedAt": "2021-01-01T00:00:00.000Z",
    "OrderId": 1,
    "OrderStatus": "NEW",
    "Customer": {
        "FirstName": "John",
        "LastName": "Doe"
    },
    "Items": [
        {
            "ProductId": 1,
            "ProductName": "Product 1",
            "Quantity": 2
        },
        {
            "ProductId": 2,
            "ProductName": "Product 2",
            "Quantity": 1
        }
    ]
}'
And one more sample for "Array of Strings" message:
curl --location 'http://localhost:9092/csp/rest/v1/inbox?import_to=Sample.Message.SomeArray.Root' \
--header 'Content-Type: application/json' \
--data '[
    "111",
    "222",
    "333"
]'
Visual traces for these requests can be seen in the messages of the Inbox.Service.API business service. Check: Interoperability > Production Configuration - (Production.Main).
In Production, configured two test consumers, one for "Customer Order" and the other for "Array of Strings" message types. After messages are received by the Inbox API, you can see that them was processed in the Sample.Service.CustomerOrderConsumer or Sample.Service.StringArrayConsumer services.
Monitoring and Alerting (Alert.*)
In IRIS ESB, we have a flexible alerting module to set up subscriptions and ways to deliver alerts when something goes wrong in our data flows.
How alerting works
You should create a process in the Production based on Alert.Process.Router class and call it Ens.Alert. The process, with this name, will automatically collect all alerts from Production items for which raised flag Alert on Error. It is the default way to create an alert processor, described in the documentation here.
Next, you need to fill Lookup Tables named by notifier types. For example, table names can be like Alert.Operation.EmailNotifier, Alert.Operation.SMSNotifier and so on (you can add your own notifier implementations to the Alert.Operation.* package). It should be the names of Production config items. But I strongly recommend just using class names for Production item names, always when it is possible.
For each of these tables, Key means the source of the exception (name of Production business host). Value means contact ID (e-mail address for EmailNotifier, for example). Value can be empty when we use the notifier without forwarding the alert to a specific address.
For testing alerts, you can just raise the ThrowError flag in one of the test handlers. In Production, already set up LogFileNotifier, so alerts will be written to /tmp/alerts.log file.
Metrics
During message processing, IRIS ESB collects various metrics, including performance sensors such as the minimum, maximum, and average time of message processing (by consumers). Additionally, collecting statistics by message status: OK, ERROR, and PENDING counters.
These metrics are published via API (see GET http://localhost:9092/api/monitor/metrics endpoint), collected by Prometheus, and visualised by Grafana. Added custom metrics have a tag esb_broker. Web UI for these applications is available at:
http://localhost:9090- Prometheushttp://localhost:3000- Grafana
Try it
You should have installed Docker Desktop and Git on your local PC. Clone the repository and run Docker containers:
git clone https://github.com/ogurecapps/iris-esb.git
cd iris-esb
docker-compose up -d
Interoperability Production will be available on the URL (use default credentials _system SYS for login): http://localhost:9092/csp/esb/EnsPortal.ProductionConfig.zen?$NAMESPACE=ESB
Send test messages as described in the Inbox API testing section. You can see traces of receiving messages in the Inbox.Service.API and traces of processing messages in the Sample.Service.CustomerOrderConsumer.
Open Grafana at http://localhost:3000 (default credentials are admin admin). Add a data source: choose Prometheus as data source type and enter Server URL as http://host.docker.internal:9090. Add dashboard: select New > Import and take a ready-to-use JSON from this Developer Community article, for example.
Enjoy! Now you have an ESB with API and monitoring. Now it remains only to add your own message types and data flow implementations.
Last checked by moderator
19 Jan, 2026WorksMade with
Version
1.0.101 Mar, 2026
Category
Works with
InterSystems IRISFirst published
03 Oct, 2025Last edited
28 Feb, 2026