
iris-python-suite  Issue Detected


 0
0 11
11
What's new in this version
Including video.
IRIS Python Suite
A set of tools and examples (or experiments) using Python as application language and the IRIS as a database
to observe and learn how to use IRIS Native API.
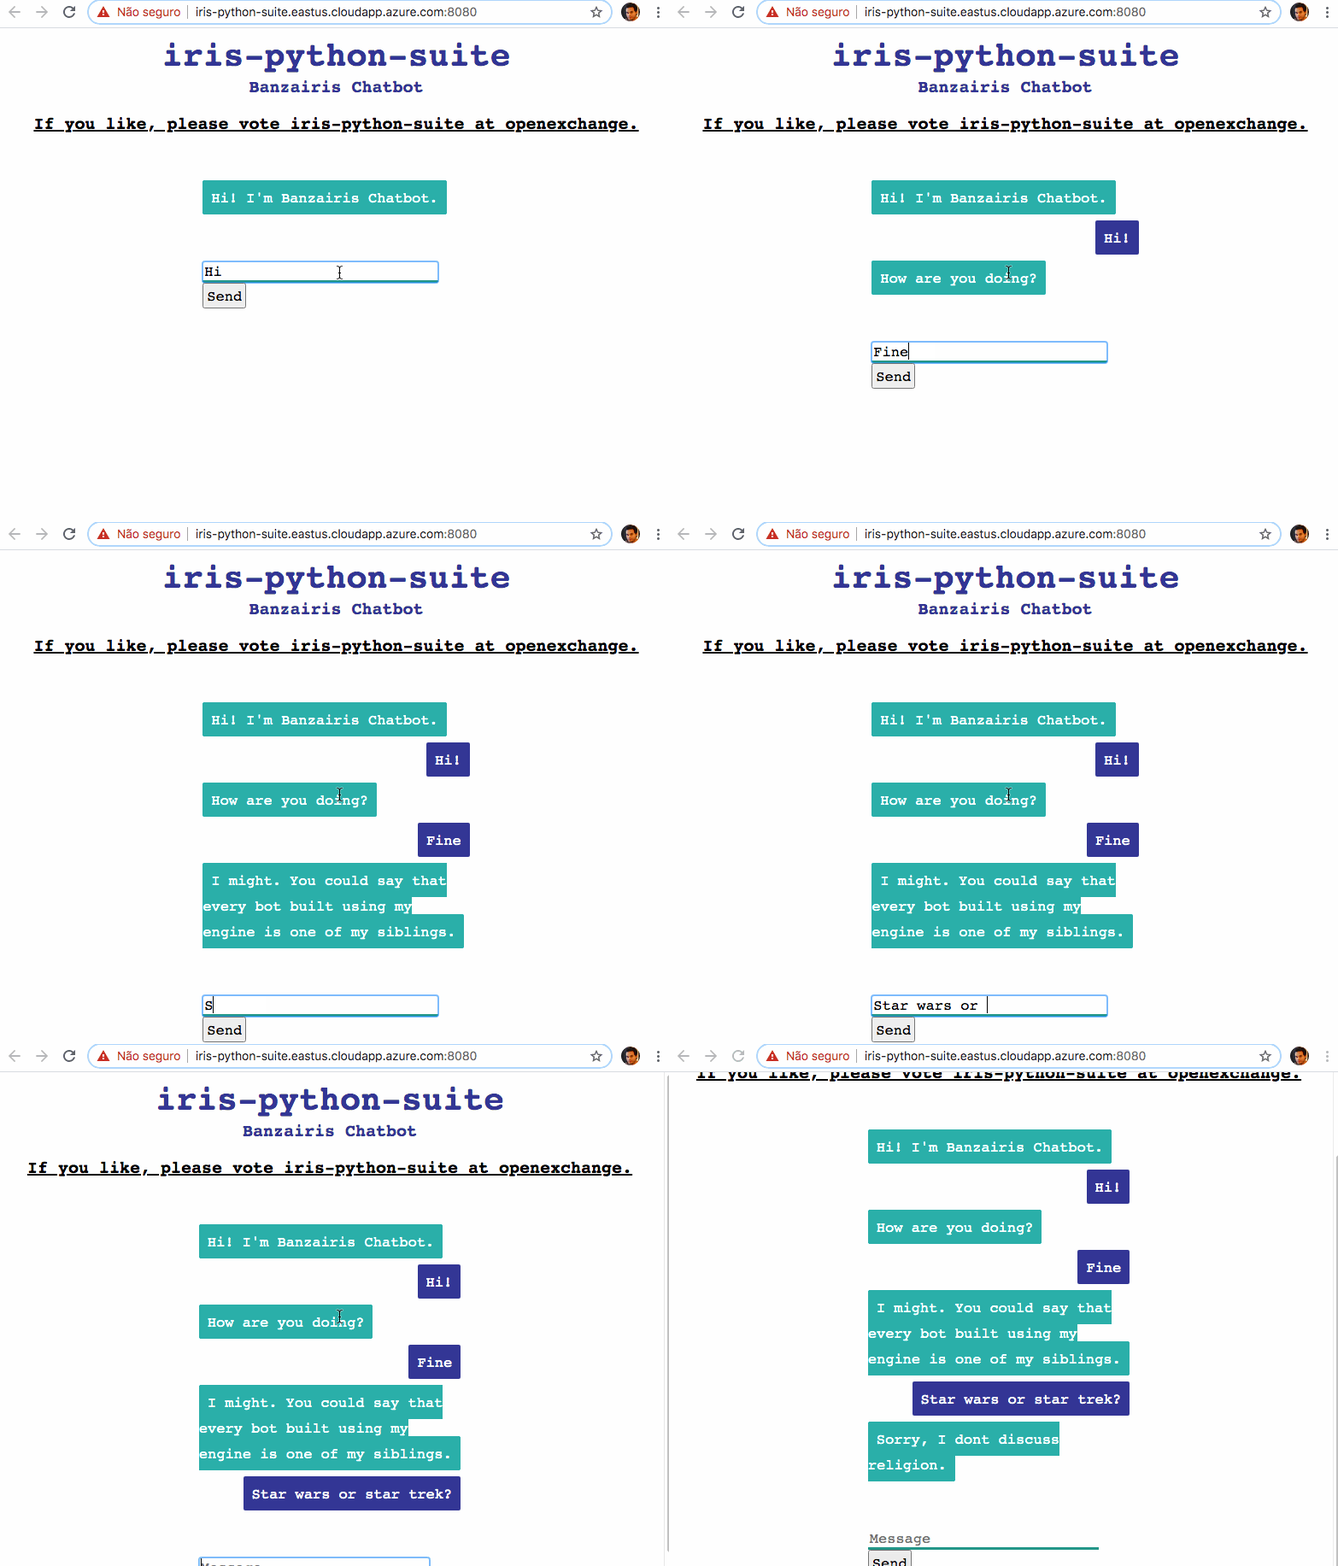
Banzairis Chatbot
A chatbot home-made using Chatter + Python Native API to store the conversations and training data. You can edit the
training data on main application and automatically the next load on chatbot page will perform the training
(some seconds needed).
Demo
I have deployed the chatbot as a demo here:
http://iris-python-suite.eastus.cloudapp.azure.com:8080
To look/edit custom training data:
http://iris-python-suite.eastus.cloudapp.azure.com/chatbot-training-data
The application use those question and answer to training a machine learning model.
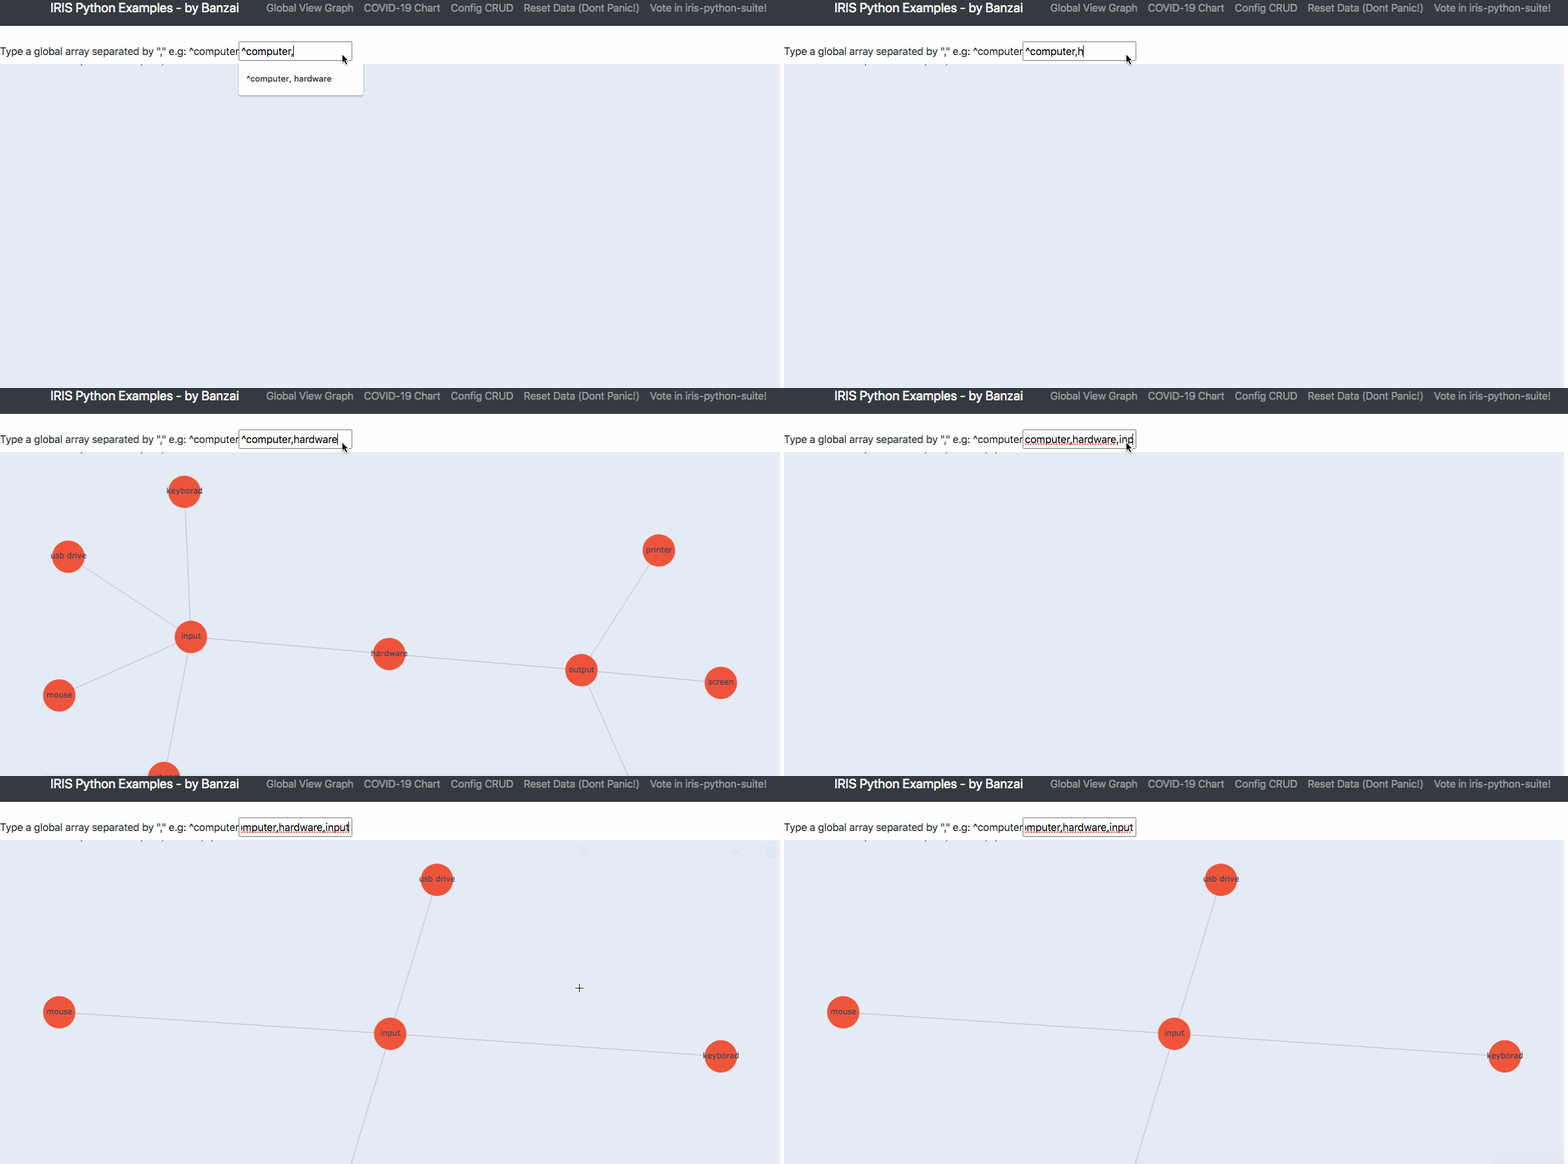
IRIS Python Global Viewer Graph Chart
Using the Python Native API to view globals as graphs. Just put one of IRIS Globals Array at the input field to see an
interactive graph.
Demo
I have deployed the application as a demo here:
http://iris-python-suite.eastus.cloudapp.azure.com/covid19-chart
Global Viewer Chart
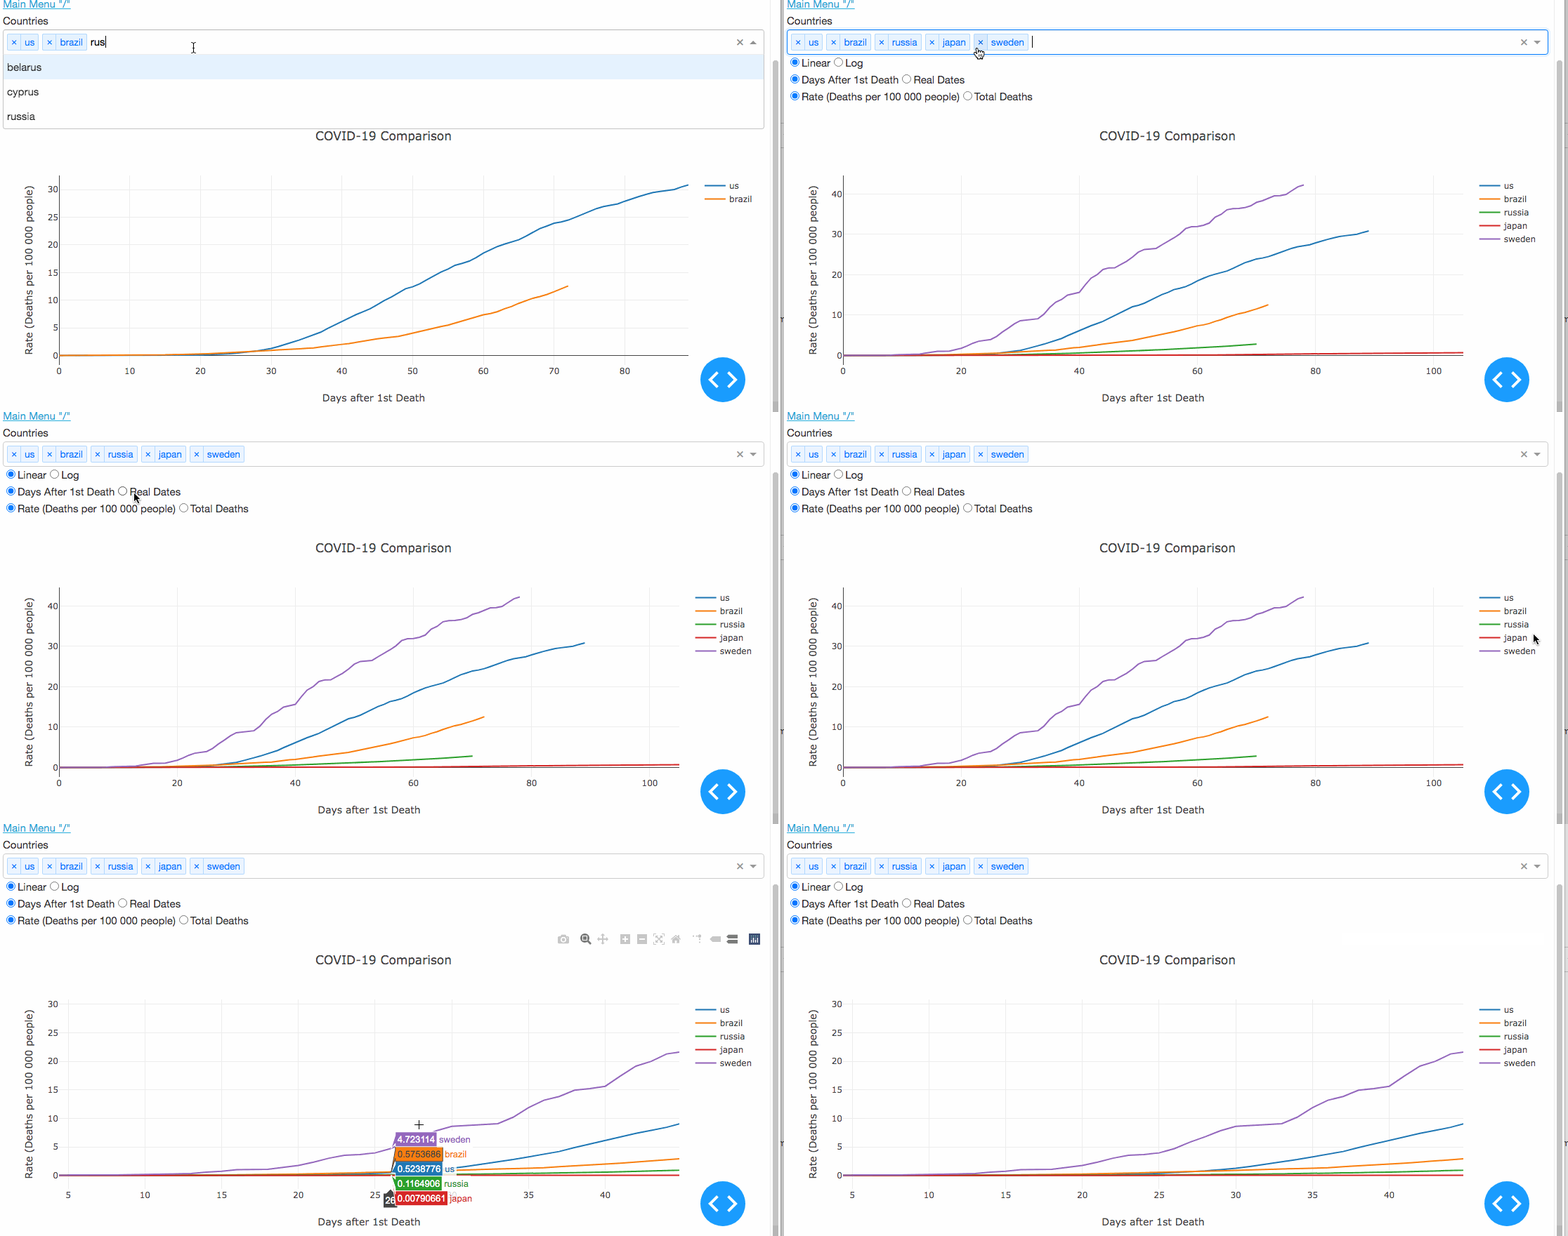
IRIS Python COVID19 Chart
As the pandemy evolves in the world a lot of information are being spreaded so I decided to create an application to audit those information.
Unfortunately each country has a different test policy so I decided to use the death data to avoid the cases subnotifications.
Demo
I have deployed the application as a demo here:
http://iris-python-suite.eastus.cloudapp.azure.com/global-chart
COVID19 Chart
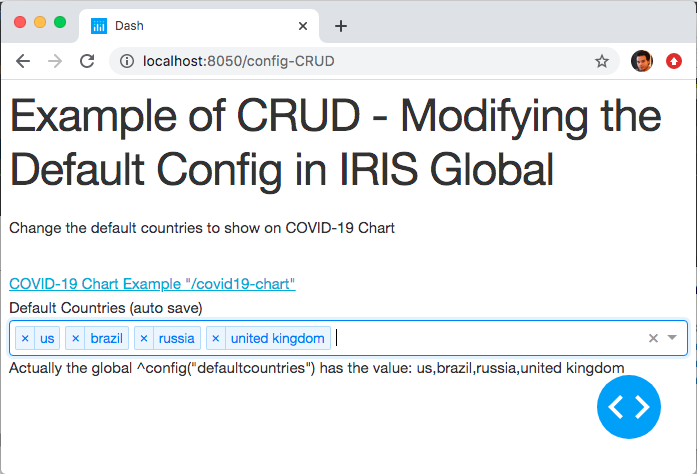
IRIS Python CRUD Example
An interactive dropdownlist talking with a correspondent global to set the Countries Default on Chart.
Tools
A set of classes in python using the IRIS Native API:
- irisdomestic: A class that I made to show one way I use the Native API extending the native api.
#has the same methods of irisnative + factory of irisglobal class
-
irisglobalchart: A component to plot any global as a network graph chart.
-
irisglobal: A class that I made to be filled as a Graph Data Structure and all recursive. So if you instatiate one irisglobal
object all global data will be in memory in this object.
Imagine a global like this*
^covid19("countries", "us")=5000
^covid19("countries", "us", "newyork")=10
^covid19("countries", "brazil", )=100
With my class irisglobal in python you have just to instatiate
to have access to all global nodes in memory and indexed as a dictionary.
obj_global = irisglobal("^covid19")
print(obj_global.subscripts["countries"].subscripts["brazil"].value)
100
Getting started
Prerequisites
- git
- docker and docker-compose adjust docker settings to up memory and cpu the AI demands more capacity
- access to a terminal in your environment
Installing
After cloning this repo open a terminal go to the iris-python-covid19 folder and type these commands:
git clone https://github.com/renatobanzai/iris-python-covid19.git
Building and running the docker-compose
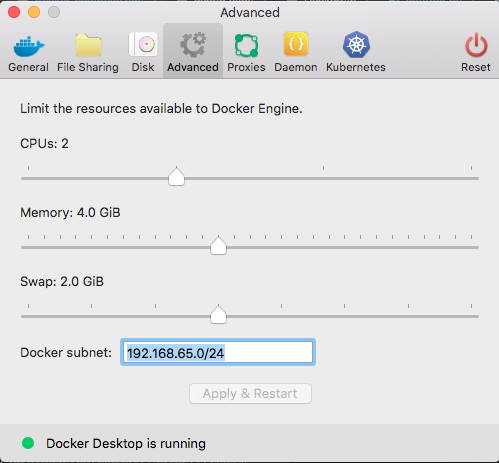
adjust docker settings to up memory and cpu the AI demands more capacity
- 4GB Memory (or more if you can)
- 2CPU (or more if you can)
Need to set more memory to docker engine
Running in linux and MacOS
docker-compose build
docker-compose up
Running in Windows
docker-compose -f docker-compose-windows.yml build
docker-compose -f docker-compose-windows.yml up
Estimated time to up containers
1st time running will depend of your internet link to download the images and dependencies.
If it last more than 15 minutes probably something goes wrong feel free to communicate here.
After the 1st time running the next ones will perform better and take less then 2 minutes.
If is everything ok
After a while you can open your browser and go to the address:
- Main Menu: http://localhost:8050
- Chatbot: http://localhost:8080
Main Menu
The project has a main menu that points you to all the examples. Feel free to navigate.
- Globals as Graph Chart
- COVID19 Graph
- CRUD of Default Configs
- Maintenance of Training Data to Chatbot
- Conversation with the Chatbot
You should look at IRIS Admin Portal
I’m using for now the USER namespace (todo: create my onw namespace)
http://localhost:9092
user: _SYSTEM
pass: theansweris42
How does it work?
This is a python application using the IRIS service to persist and read data. I use globals to store raw data from JHU and plot it using Python community libraries. All code in ./app folder.
Here some articles link to understant better the application:
- iris-python-suite-hitchhikers-guide-global-1
- using-python-represent-globals-network-chart
- creating-chatbot-iris-and-python
- help-my-chatbots-learn-language
Videos about this application
If you don’t want to run local
I deployed all the application at Azure, take a look at http://iris-python-suite.eastus.cloudapp.azure.com/
Note of condolence
For everyone who lost any loved one for COVID-19 I would like to extend my heartfelt condolence. May my condolences bring you peace during this painful time.
Thanks
Collaboration are welcome! I’ll perform some changes here in the code but I think it’s a good start to the ones who use python!


