© 2026 InterSystems Corporation, Cambridge, MA. All rights reserved.Privacy & TermsGuaranteeSection 508Contest Terms

iris-python-apps 

4
1 reviews
2
Awards
1.7k
Views
0
IPM installs
 2
2 1
1
Details
Releases (2)
Reviews (1)
Awards (2)
Issues
Articles (4)
Python IRIS Dashboard, Data Sciences, Plotting and Visualization
What's new in this version
- Article is added
- Plotting from HTML
- Jupyter Notebook is added from demonstrate below functionality
- Introduction to Data Sciences
- Plotting and Visualization
- QR Code generation
Summary
IRIS Dashboard build by using embedded python with the help of Python Flask Web Framework.
Application also demonstrates some of the Python functionality like Data Science, Data Plotting, Data Visualization and QR Code generation.
Features
- Responsive bootstrap IRIS Dashboard
- View dashboard details along with interoperability events log and messages.
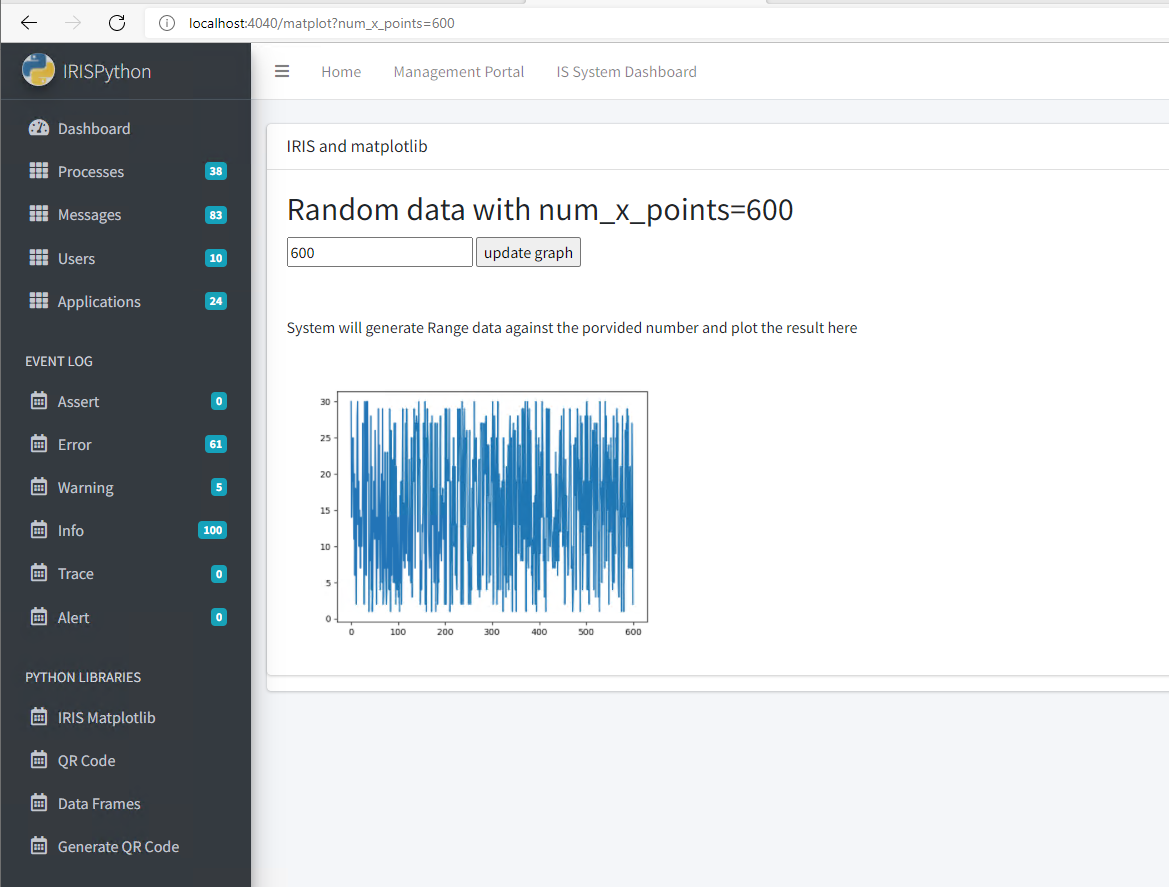
- Python plotting from IRIS
- Use of Jupyter Notebook
- Introduction to Data Science, Data Plotting and Data Visualization.
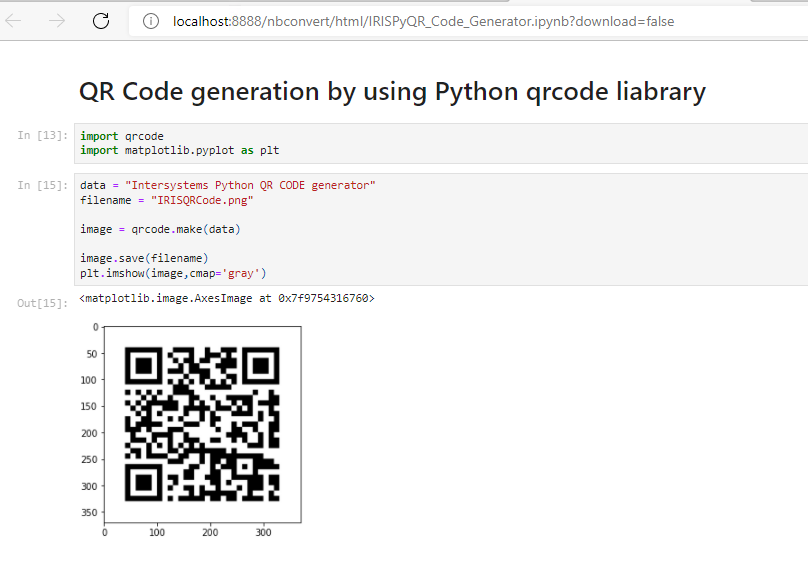
- QR Code generator from python.
Application Layout
Dashboard

Tables Data

Plotting with Python matplotlib library
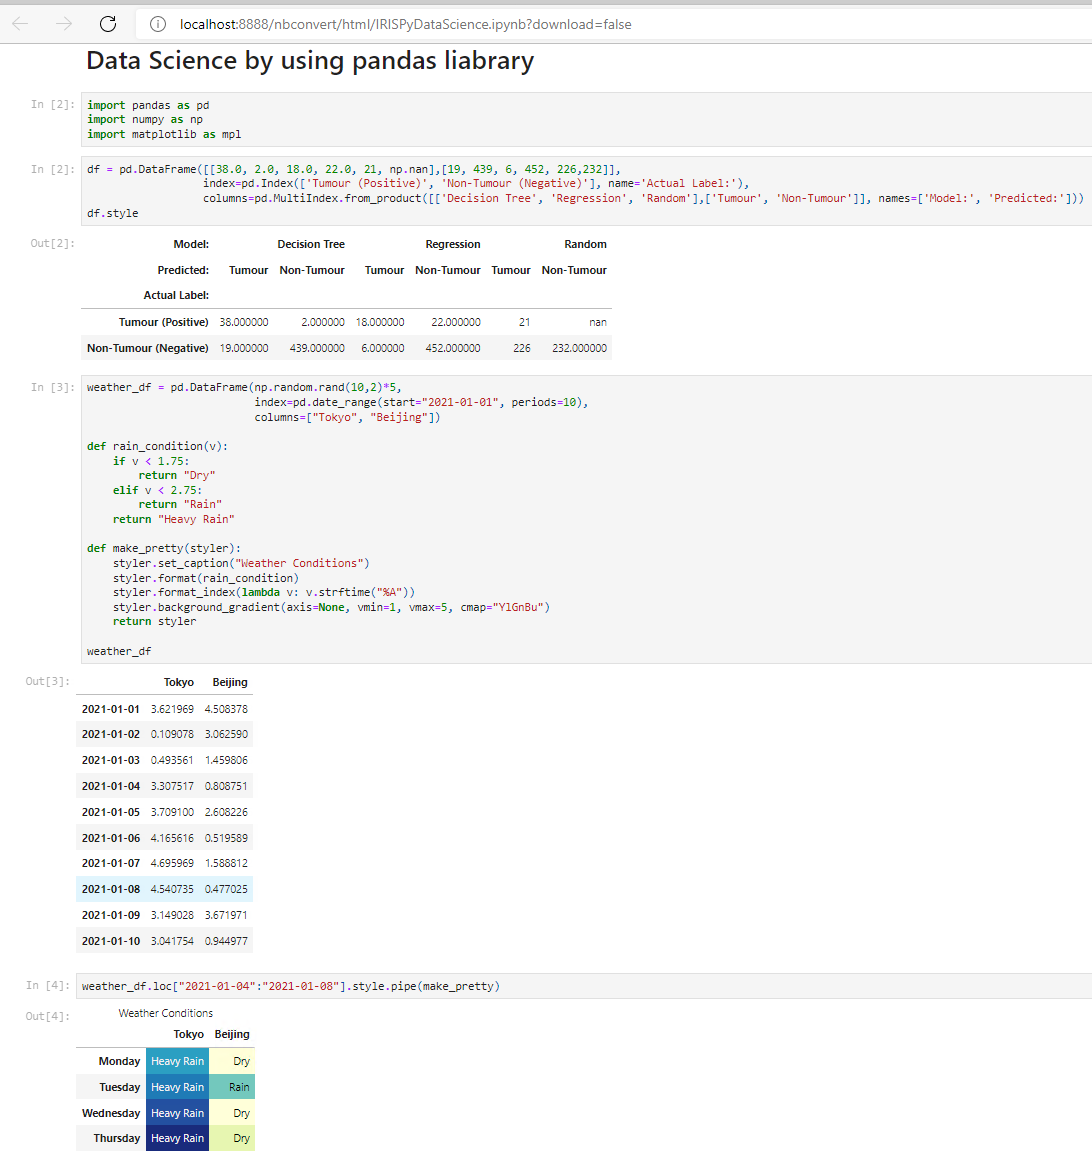
Introduction to Data Science by using jupyter Notebook
Dataploting by using python matplotlib Library

Introduction to Data Visualization by using jupyter Notebook

QR Code generation with Python
Recommendation
- Read related documentations Embedded Python Overview.
Installation
- Clone/git pull the repo into any local directory
git clone https://github.com/mwaseem75/iris-python-apps.git
- Open a Docker terminal in this directory and run:
docker-compose build
- Run the IRIS container:
docker-compose up -d
To run the application Navigate to http://localhost:4040
Last checked by moderator
20 Jan, 2026WorksMade with
Version
1.0.122 Feb, 2022
Ideas to the app
Category
Works with
InterSystems IRIS for HealthFirst published
20 Feb, 2022Last edited
23 Feb, 2022