© 2026 InterSystems Corporation. All rights reserved.Privacy & TermsGuaranteeSection 508Contest Terms


Water Conditions in Europe 

Community Project
This project is maintained by its author and is not officially supported by InterSystems. For technical support, please contact the project developer.
This project is maintained by its author and is not officially supported by InterSystems. For technical support, please contact the project developer.
5
2 reviews
1
Awards
539
Views
0
IPM installs
 0
0 Add to bundle
Details
Releases (2)
Reviews (2)
Awards (1)
Issues
Videos (1)
Articles (1)

Water Conditions with Prediction, Dashboards and more
What's new in this version
- IRIS BI textMeter widgets: added
dataPropertybindings inOverview.dashboard— DSW 4.x only renders measures listed in data properties - IRIS BI UomTable: replaced removed
Country.Uomproperty with[idwaterresultuom].[H1].[Label]row level (fixes@NOPROPERTY) - KPI pivots (
MeanPollution,MeanOutsideInfluence,VenueCount): measure defined viacolumnLevelinstead of deprecated<measure>element - Docker build: replaced deprecated PyPI package
sklearnwithscikit-learninrequirements.txt - Docker build: removed automatic cube build from ZPM
Invokes— failed cube activation rolled back module installation and data - Flask/Dash app: replaced obsolete
app.run_server()withapp.run()for Dash 4.x compatibility - Container startup: replaced
exit 1withwaitinserver_start.shso background processes keep running - DeepSee cube: removed duplicate
Uomproperty fromCountrylevel inwaterPollutionCube(18 833 build errors) - IRIS BI / DSW: added
SetupDSWAddons()to register and compileDSW.Addons.*portlet classes for worldMap and other addons
water-conditions-Europe
This app shows data visualization.
It uses python ML to predict future values of water conditions.
It also uses few visualisation machanisms like PowerBI and Tableau by Adaptive Analytics at backend.
IRIS BI dashboard also included.
For example, Water Conditions in Europe region data was used.
The Dash framework used to build Dashboards in a Python framework created by plotly for building interactive web applications.
Dash is open source and building an application using this framework is viewed in a web browser.
Installation
Docker
The repo is dockerised so you can clone/git pull the repo into any local directory
$ git clone https://github.com/teccod/water-conditions-Europe.git
Open the terminal in this directory and run:
$ docker-compose up -d
The first time launch can take some time because of python libraries installing.
App
After installation open http://localhost:8080/

The main page will show the links to Dashboards, which display different visualisation tools.
On the left is the navigation menu.
- Home - shows the title
- Timeline - a map is shown, there is a player at the bottom of the map, timeline shows the dynamics of data on the world map
- IRIS BI - dashboard based on IRIS BI technology
- Logi Report - a PDF form of the Report generated by the Intersystems Reports powered by Logi Reports
- PowerBI Report - dashoard on PowerBI engine embedded
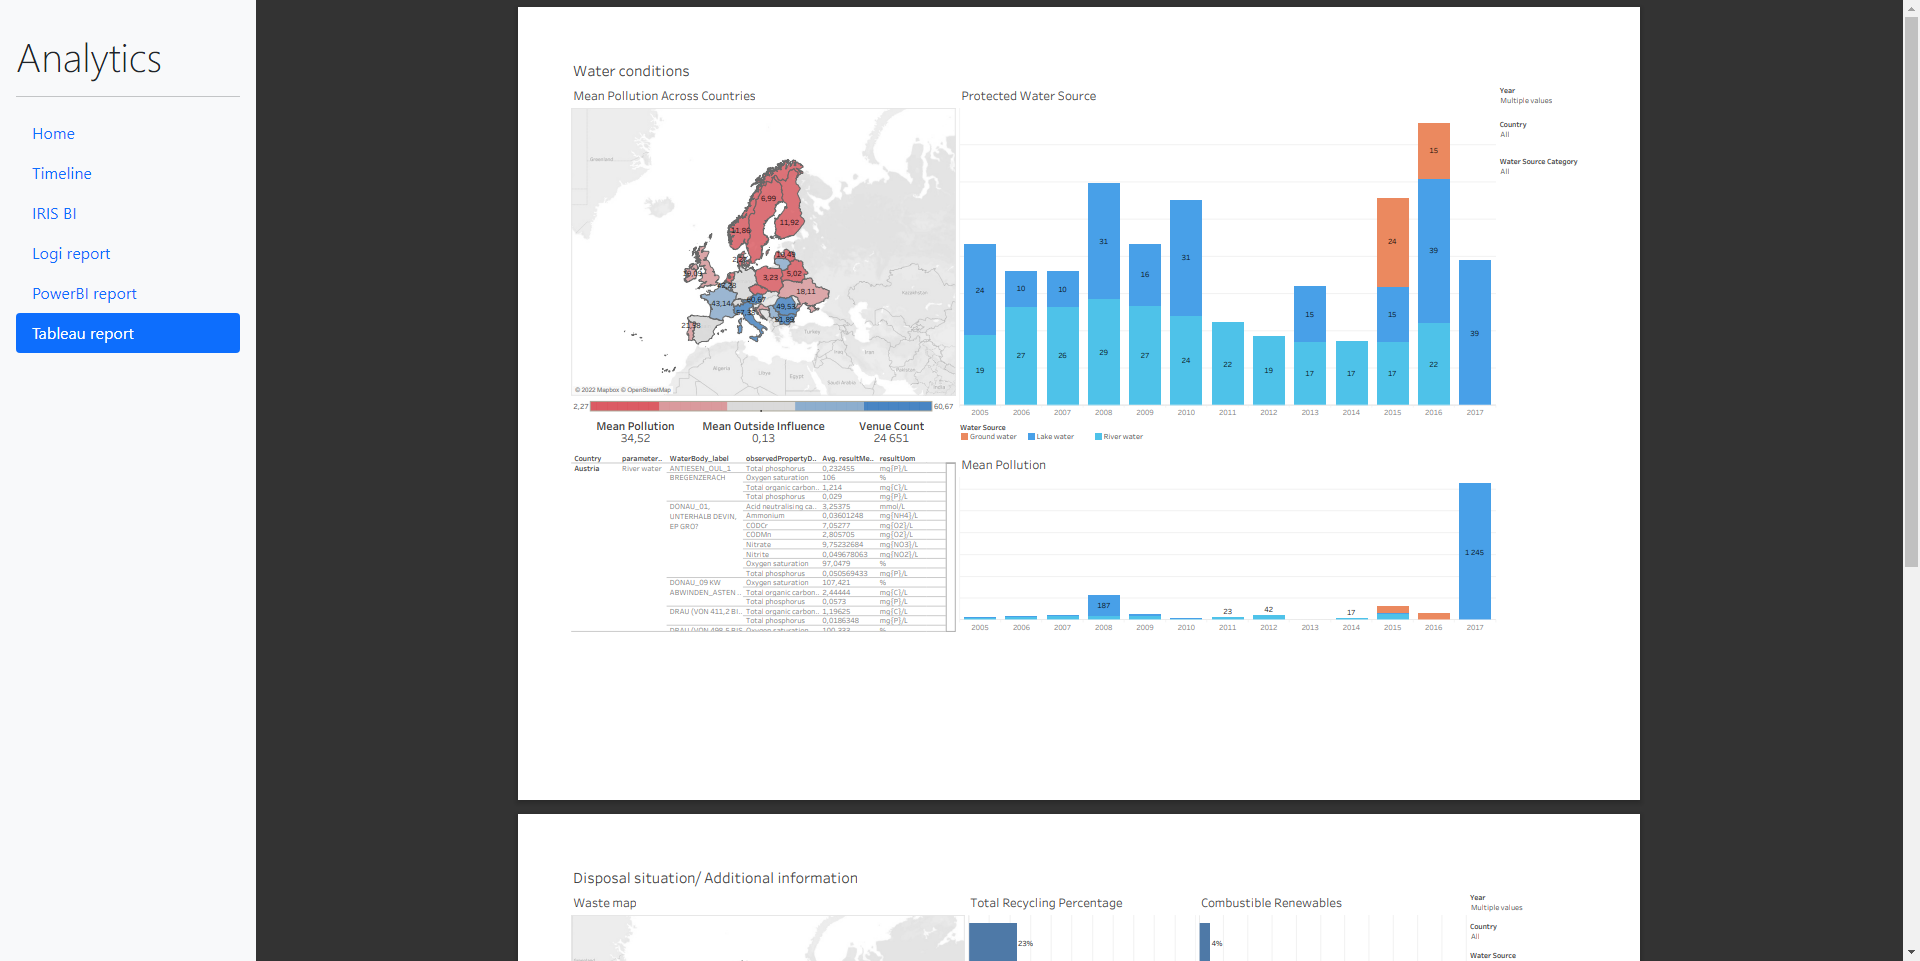
- Tableau Report - dahboard on Tableau engine published from public.tableau.com
Online demo link : http://atscale.teccod.com:8080/
Screenshots
Timeline

IRIS BI

Logi Report
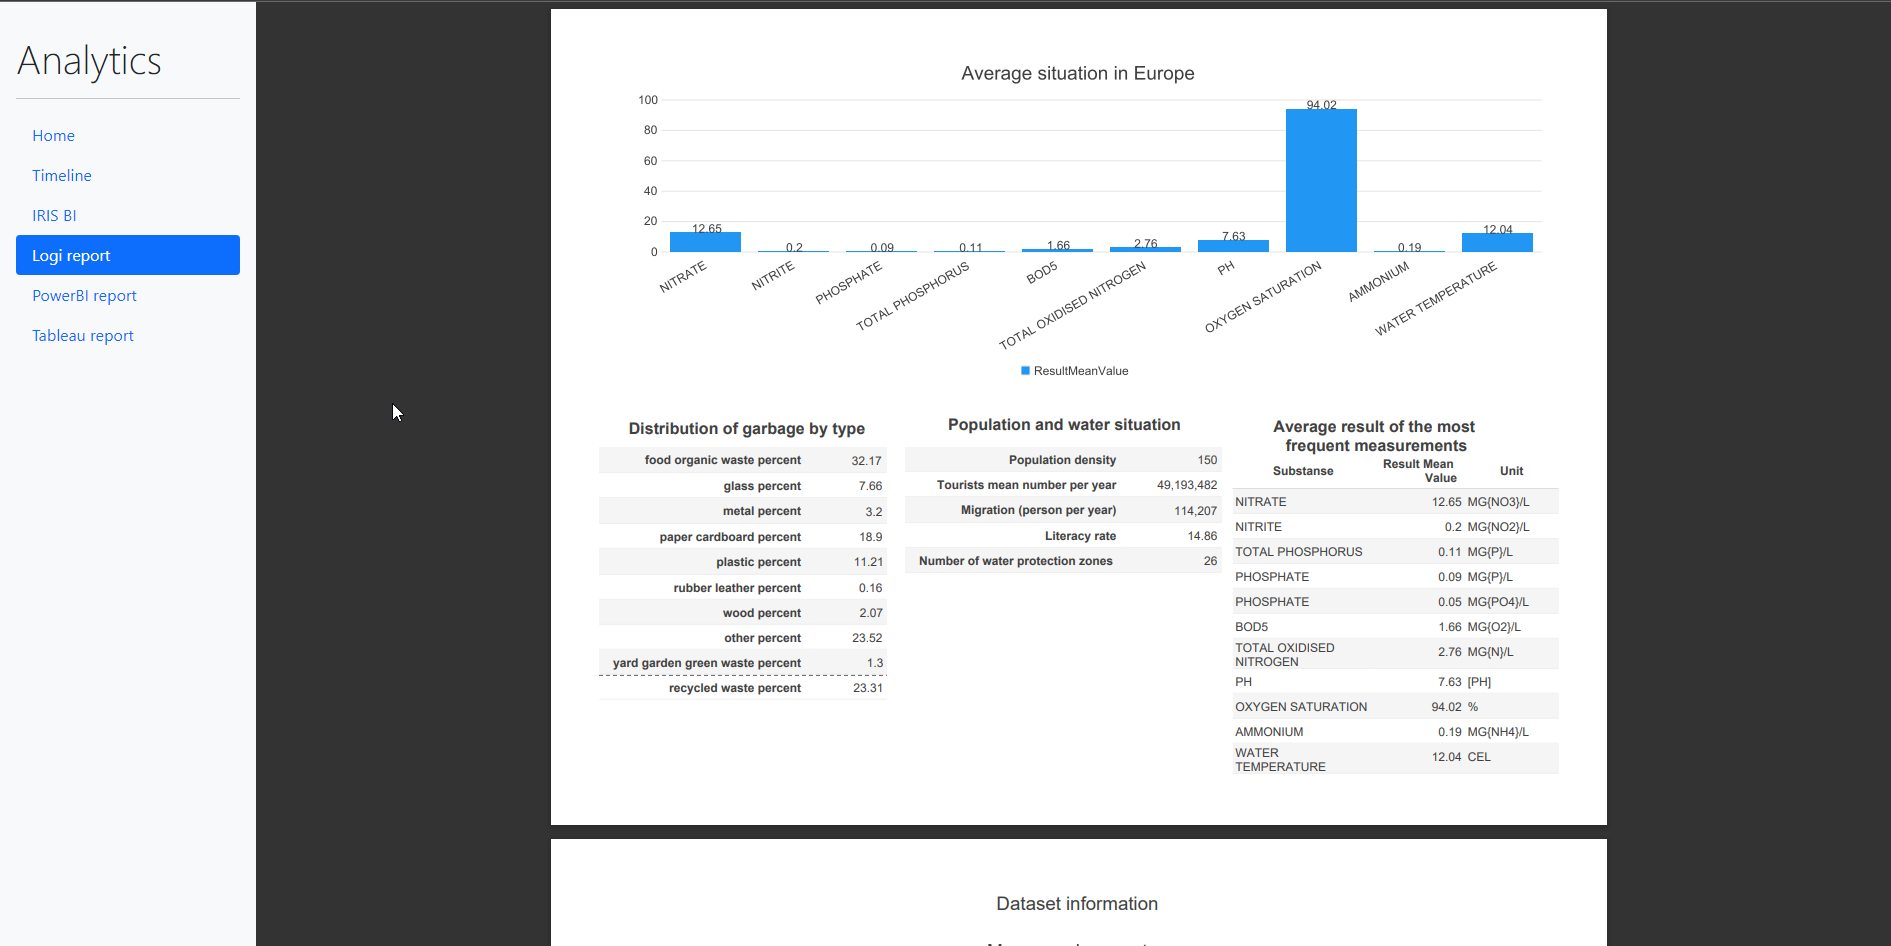
PowerBI Report

Tableau Report
More info about ML prediction used here
In this article I describe how ML on embedded python used in this project and compare it with IntegratedML test
Last checked by moderator
16 Jul, 2026, Works
Made with
Version
1.0.215 Jul, 2026
Category
Technology ExampleWorks with
InterSystems IRISInterSystems IRIS BIFirst published
29 May, 2022Last edited
15 Jul, 2026