© 2026 InterSystems Corporation, Cambridge, MA. All rights reserved.Privacy & TermsGuaranteeSection 508Contest Terms

opentelemetry-trace-soap 

5
1 reviews
0
Awards
710
Views
0
IPM installs
 0
0 0
0
Details
Releases (1)
Reviews (1)
Issues
Videos (1)
Articles (1)
Send OpenTelemetry from IRIS SOAP Web services
What's new in this version
Initial Release
OpenTelemetry Tracing for IRIS SOAP Services
This applications is s aolution that implements OpenTelemetry tracing for IRIS implemented SOAP Web Services.
It’s fair to say that IRIS data platform has several ways to capture, log and analyse the performance of a running instance, this information does not flow out of IRIS through to other opentelemetry components like Agents or Collectors within an implemented OpenTelemetry-supported stack. Several technologies already support OpenTelemetry and it is fast becoming an adopted standard in the world of Observability.
Whilst there is ongoing development to natively support this observability standard in future IRIS releases, this article explains how, with the help of the Embedded Python and the corresponding Python libraries, IRIS application developers can start publishing Trace events to your OpenTelemetry back-ends with minimal effort. More importantly, this gives my customer somethign to get up and running with today.
Observability.
Observability generally comprises of three main aspects:
- Metrics capture, which is the capture of quantitative measuremements about the performance and behaviour of a system, similar to what IRIS publishes via its /api/monitor/metrics api
- Logging, which involves capturing and storing relevant information generated by an application or system, such as what appears in System Log outputs, or messages.log file generated by IRIS instances.
- Tracing: which involves tracking the flow of a service request or transaction as it moves through various components of a solution. Distributed tracing allows you to follow the path of a request across multiple services, providing a visual representation of the entire transaction flow.
This application focuses solely on Tracing of SOAP Services.
A Trace identifies an operation within a solution that, in fact, can be satisfied via multiple technologies in an architecture, such as browser, load balance, web server, database server, etc.
A Span represents a single unit of work, such as a database update, or database query. A span is the building block of a Trace, and a Trace starts with a root Span, and optionally nested, or sibling spans.
In this implementation which is only using IRIS as the technology to generate telemetry, a Trace and root Span is started when the SOAP Service is started.
Approach for implementation:
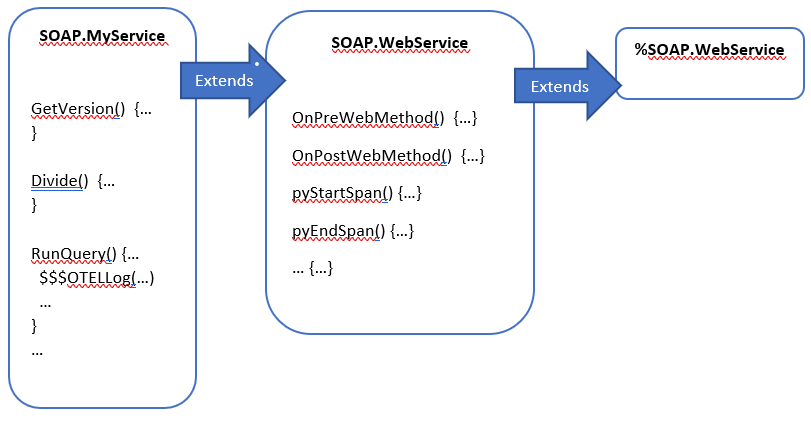
Subclass IRIS’s %SOAP.WebService class with OpenTelemetry implementation logic and Python library functions in a new calss called SOAP.WebService. Include Macros that can be used in user code to further contribute to observability and tracing. Minimal changes to the existing SOAP implementation should be needed (replace use of %SOAP.WebService with SOAP.WebService as the Web Service superclass for implementing SOAP.
The diagram below illustrates this approach:
Features of this implementation:
- By default, every SOAP Service will be tracked and reports trace information.
- When a SOAP Service is used for the first time, the implementation will initalise an OpenTelemetry Tracer object. A combination of the IRIS Server name and Instance is provided as the telemetry source, and, the SOAP Action used as th name for the default root span tracking the soap service.
- Telemetry traces and the default span will be automatically closed when the SOAP method call ends
- Upon creation, Key/Value pairs of attributes can be added to the default root span, such as, CSP Session ID, or Job number
- Users may use the $$$OTELLog(…), to add an arbitratry manual logging into a span, using a simple string or array of key valye pairs
- Users may use the $$$OTELPushChildSpan(…)/$$$OTELPopChildSpan(…) to create non-root spans around sections of code which they want to independantly identify with their logic
Installation and testing
- Clone/git pull the repo into any local directory
$ git clone https://github.com/intersystems-community/opentelemetry-trace-soap.git
- Open a terminal window in this directory and type the following to build the IRIS images with sample code:
$ docker-compose build
- Once the iris image is build, in the same directory type the following to start up the Jaeger and IRIS containers:
$ docker-compose up -d
This will startup two containers - the Jaeger OpenTelemetry target backend container (also exposing a user interface), and, an instance of IRIS which will serve as the SOAP Web Services server endpoint.
Generating trace information for the SOAP Web Methods can be done by building SOAP client (using your favourite technology) and then calling these services, just as any user or application would do in a real-world application.
However - In order to simplify this process, and purely for demonstration purposes, we will leverage IRIS’s helper CSP pages that allows us to call these SOAP methods from a browser:
-
Using your browser access the SOAP Information and testing pages via this URL. logging in as superuser/SYS if prompted:
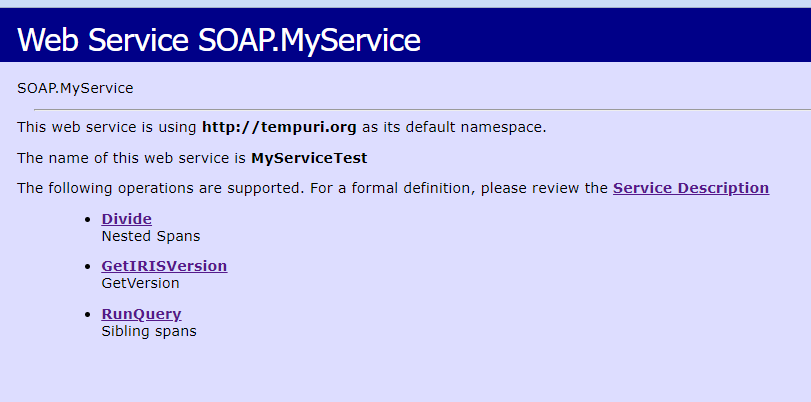
The IRIS instance hosts three simple SOAP Services:
- GetIRISVersion():
- Return the $ZV value of the IRIS instance
- Other than default telemetry data, no additonal telemetry data is generaated.
- Divide(a, b):
- This method takes two integers and returns the value of their division, during which, default relemetry data is generated.
- Additionally, the server side code uses the $$$OTELPushChildSpan(..) macro, to instantiate multiple nested span.
- These spans are visible as nested spand in the Jaeger UI
- Uses $$$OTELLog(..) with arbitrary data to add detail to the current span
- RunQuery()
- This method runs a query to count classes, during which, default relemetry data is generated.
- Demos starting an independant span tracking query prepration, and execution
- Additionally, the server side code uses the $$$OTELPushChildSpan(..) macros available, to instantiate a span that tracks the time taken to prepare the query, and subsequently a seperate span to track query execution.
- These spans are visible as siblings in the Jaeger UI
- Uses $$$OTELLog(..) with arbitrary data to add detail to the current span
The Web service functionality is trivial and largely irrelevant, but serves to show telemetry tracing in action.
Select each of the web methods you want to test, in order to generate SOAP activity. To see this implementation generate traces with a Status of ‘Error’. use zero (0) as the second number in the Divide() SOAP method in order to force a error.
(If you wish, you may also import a Postman collection found under /otherStuff, and perform an iterative automated run of multiple SOAP calls to generate more trace messages quickly)
-
Open another browser tab pull up the Jaeger UI using the following URL
-
From this home page, use the Service drop-down box to select the telemetry service: IRISHOST:IRIS, (You may need to refresh your page for the option to appear).
-
Click on the green button “Find Traces”
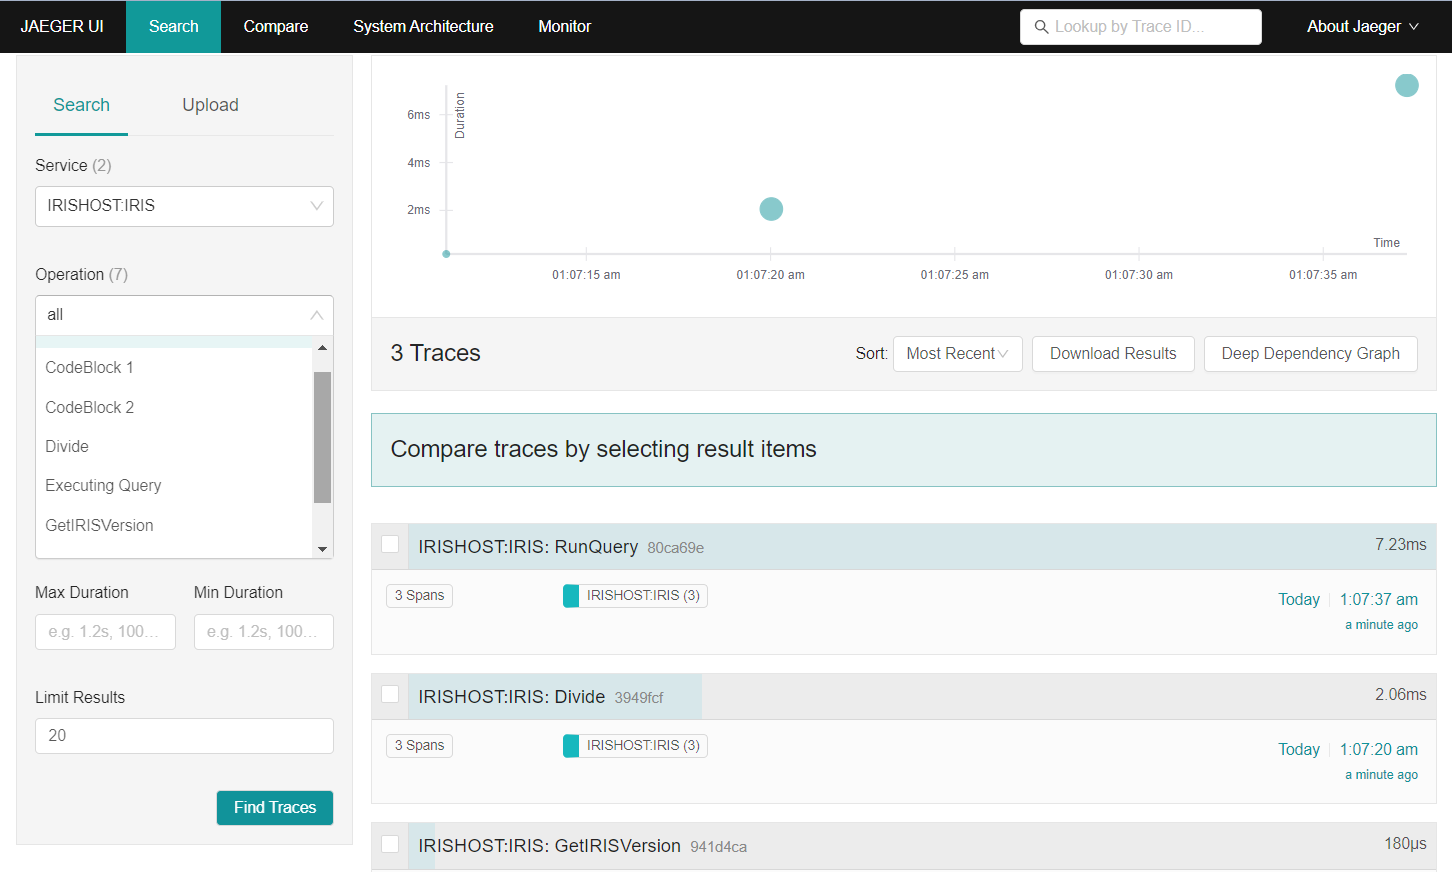
The Telemetry user interface will display record of the timeing for each of the SOAP services that where called, once for each invocation with a graph plotting performacne time. Note that there are several OpenTelemetry visualisation tools that will accept and plot telemetry data in ths same way.
-
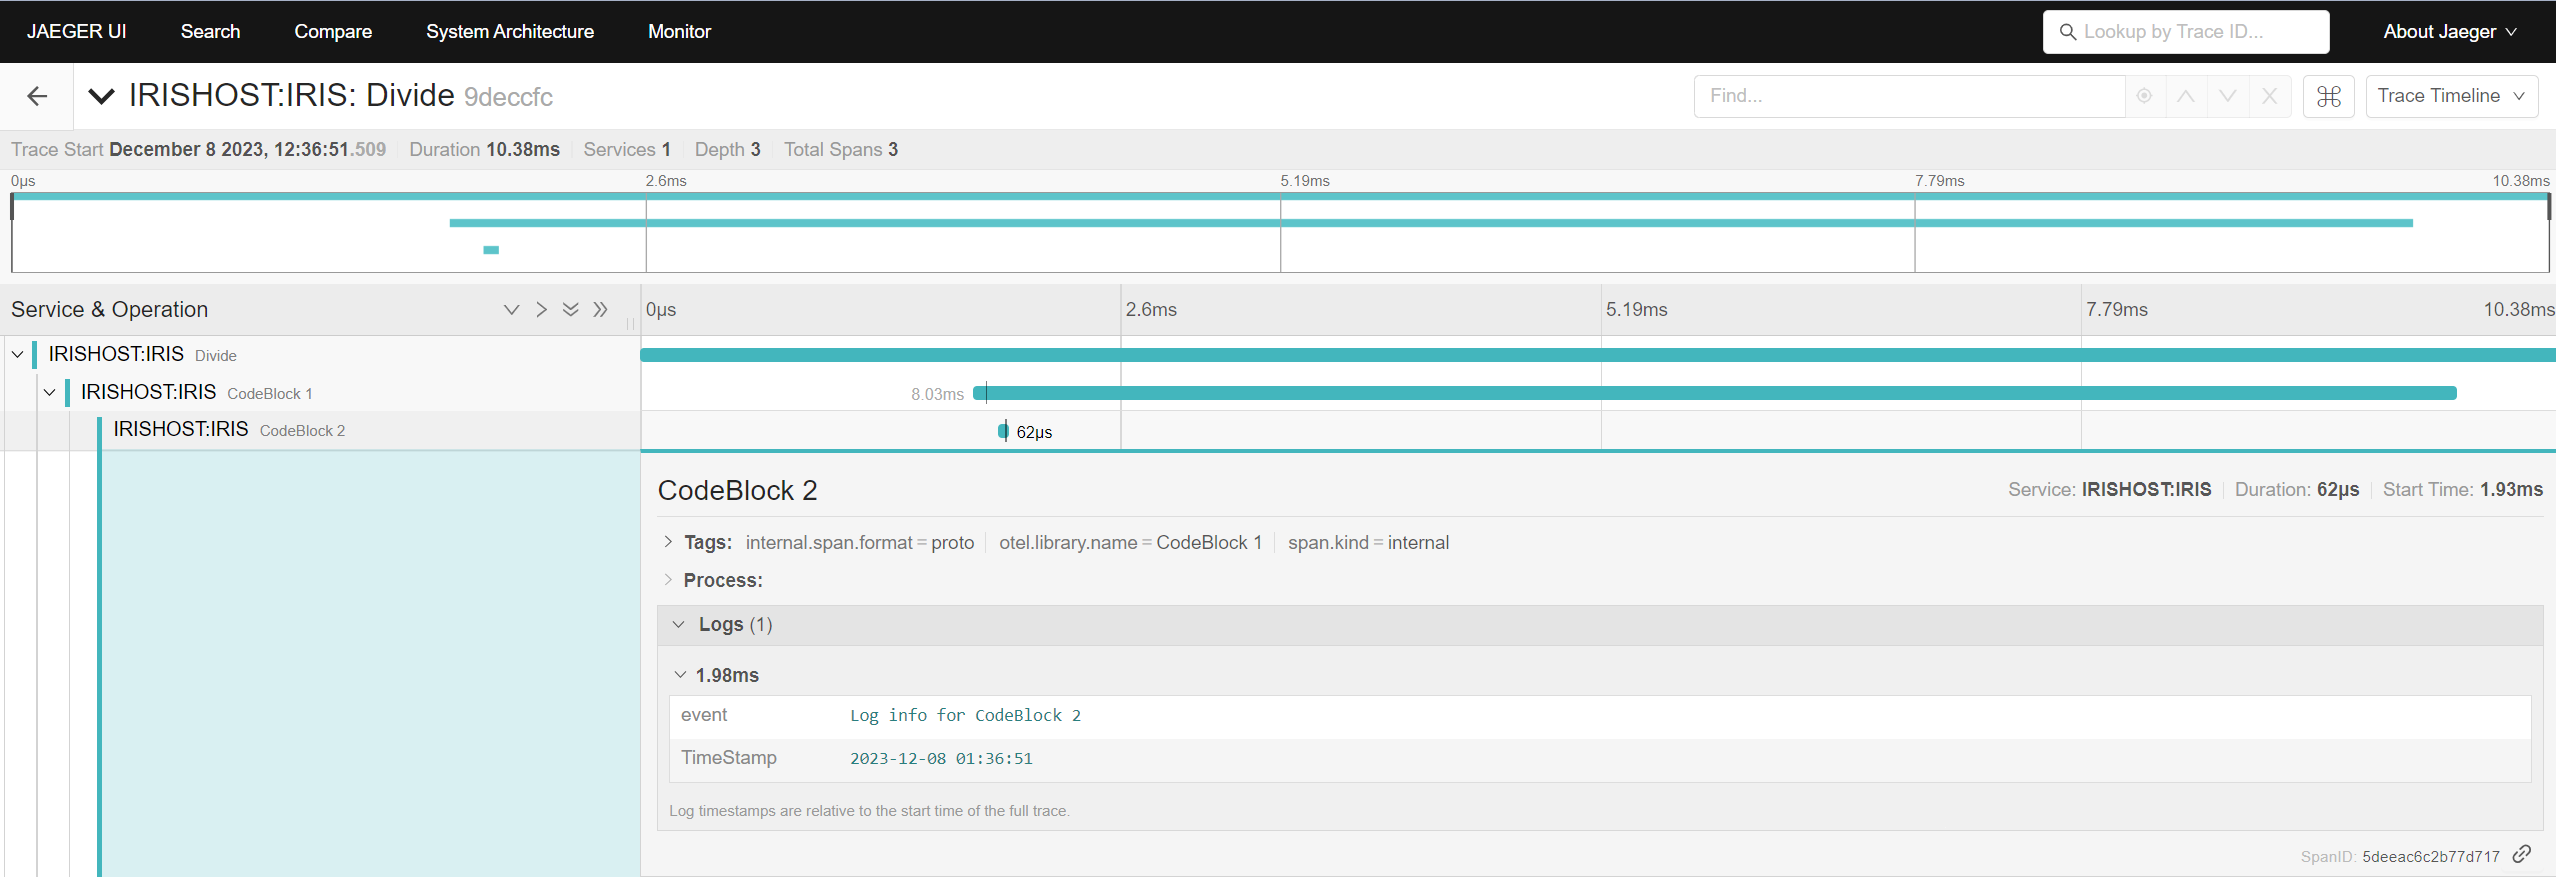
Explore the contents of each service call. For example, click on the Operation ‘Divide’ to expand and view the identified nested spans configured with this SOAP Service, as well as any arbitrary log entries.
Conclusion
In summary, this article demonstrates how Embedded Python, could be used to add additional features to IRIS, such as, support for Observability tracing for IRIS implemented SOAP services.
Looking ahead, this sample code can be enhanced and developed further, for example, the utility can be turned into a more generic OpenTelemetry support class that implements the same for REST services, or, the ability to enable any IRIS Class Method to generate and broadcast telemetry data enablked via a new method signature attribute.
Last checked by moderator
26 Jan, 2026WorksMade with
Version
1.0.008 Dec, 2023
ObjectScript quality test
PassedView reportCategory
Works with
InterSystems IRISInterSystems IRIS for HealthFirst published
08 Dec, 2023Last edited
08 Dec, 2023