© 2026 InterSystems Corporation. All rights reserved.Privacy & TermsGuaranteeSection 508Contest Terms

iris-vaccine-tracker 

Community Project
This project is maintained by its author and is not officially supported by InterSystems. For technical support, please contact the project developer.
This project is maintained by its author and is not officially supported by InterSystems. For technical support, please contact the project developer.
0
0 reviews
1
Awards
389
Views
0
IPM installs
 1
1 2
2
Details
Releases (5)
Reviews
Awards (1)
Issues
Videos (1)
Articles (1)
Showing the COVID-19 vaccination track count around the world and the COVID-19 Treatment and Vaccine development. Using as backend InterSystems IRIS in a multi-model schema.
What's new in this version
Fixed the layout to support the new features in mobile :
The dashboard offers two more widgets covering the top 10 countries with the highest % of their population vaccinated.
and the heat map presents two tabs:
The first one showing the total count of vaccinations from each country. The second heat map showing the total of vaccination means in a percentage based on the population from each country.
iris-vaccine-tracker
This project has the intention to show COVID-19 vaccination track count around the world. Using as backend InterSystems IRIS in a multi-model schema.
Prerequisites
Make sure you have git and Docker desktop installed.
I’m using IRIS image for arm64 processors; maybe you need to adjust for another image.
# ARG IMAGE=intersystemsdc/iris-community:2020.3.0.221.0-zpm
# ARG IMAGE=intersystemsdc/iris-community:2020.4.0.524.0-zpm
ARG IMAGE=intersystemsdc/iris-community-arm64:2020.4.0.524.0-zpm
Installation with ZPM
zpm:USER>install iris-vaccine-tracker
then open http://localhost:52773/csp/irisapp/index.html
Docker
The repo is dockerised so you can clone/git pull the repo into any local directory
$ git clone https://github.com/diashenrique/iris-vaccine-tracker.git
Open the terminal in this directory and run:
$ docker-compose up -d
and open and then http://localhost:52773/csp/irisapp/index.html
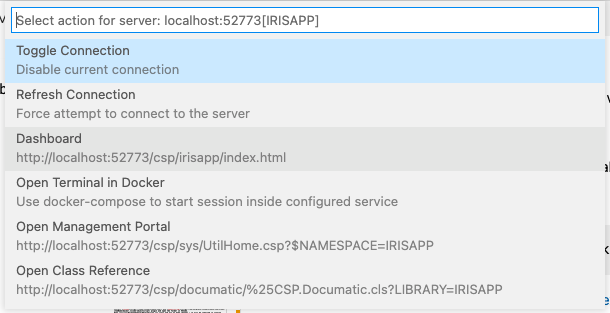
Or, open the cloned folder in VSCode, start docker-compose and open the URL via VSCode menu:
The purpose of this project
The iris-vaccine-tracker has the intention to demonstrate how you can work using a multi-model application. I’m using globals (key-value), SQL, and objects to read and deliver to the user all data presented in this application.
How this project was created
This project was created using the data provided by Our World in Data. The official repository centralize everything about COVID-19 in a fantastic and open Github repository.
Load Data
The file iris.script has the commands that reads and load all data inside the InterSystems IRIS, providing the necessary data for the dashboard.
All the files inside the folder data came from the Our World repository.
If you want to refresh the data, you can run the following command inside the folder iris-vaccine-tracker/data
$ svn checkout https://github.com/owid/covid-19-data/trunk/public/data/vaccinations/country_data
It will update the files with the latest vaccination counts from all countries; If you already started the container and want to use the latest info, just run in the terminal:
IRISAPP>do ##class(diashenrique.util.Install).Load()
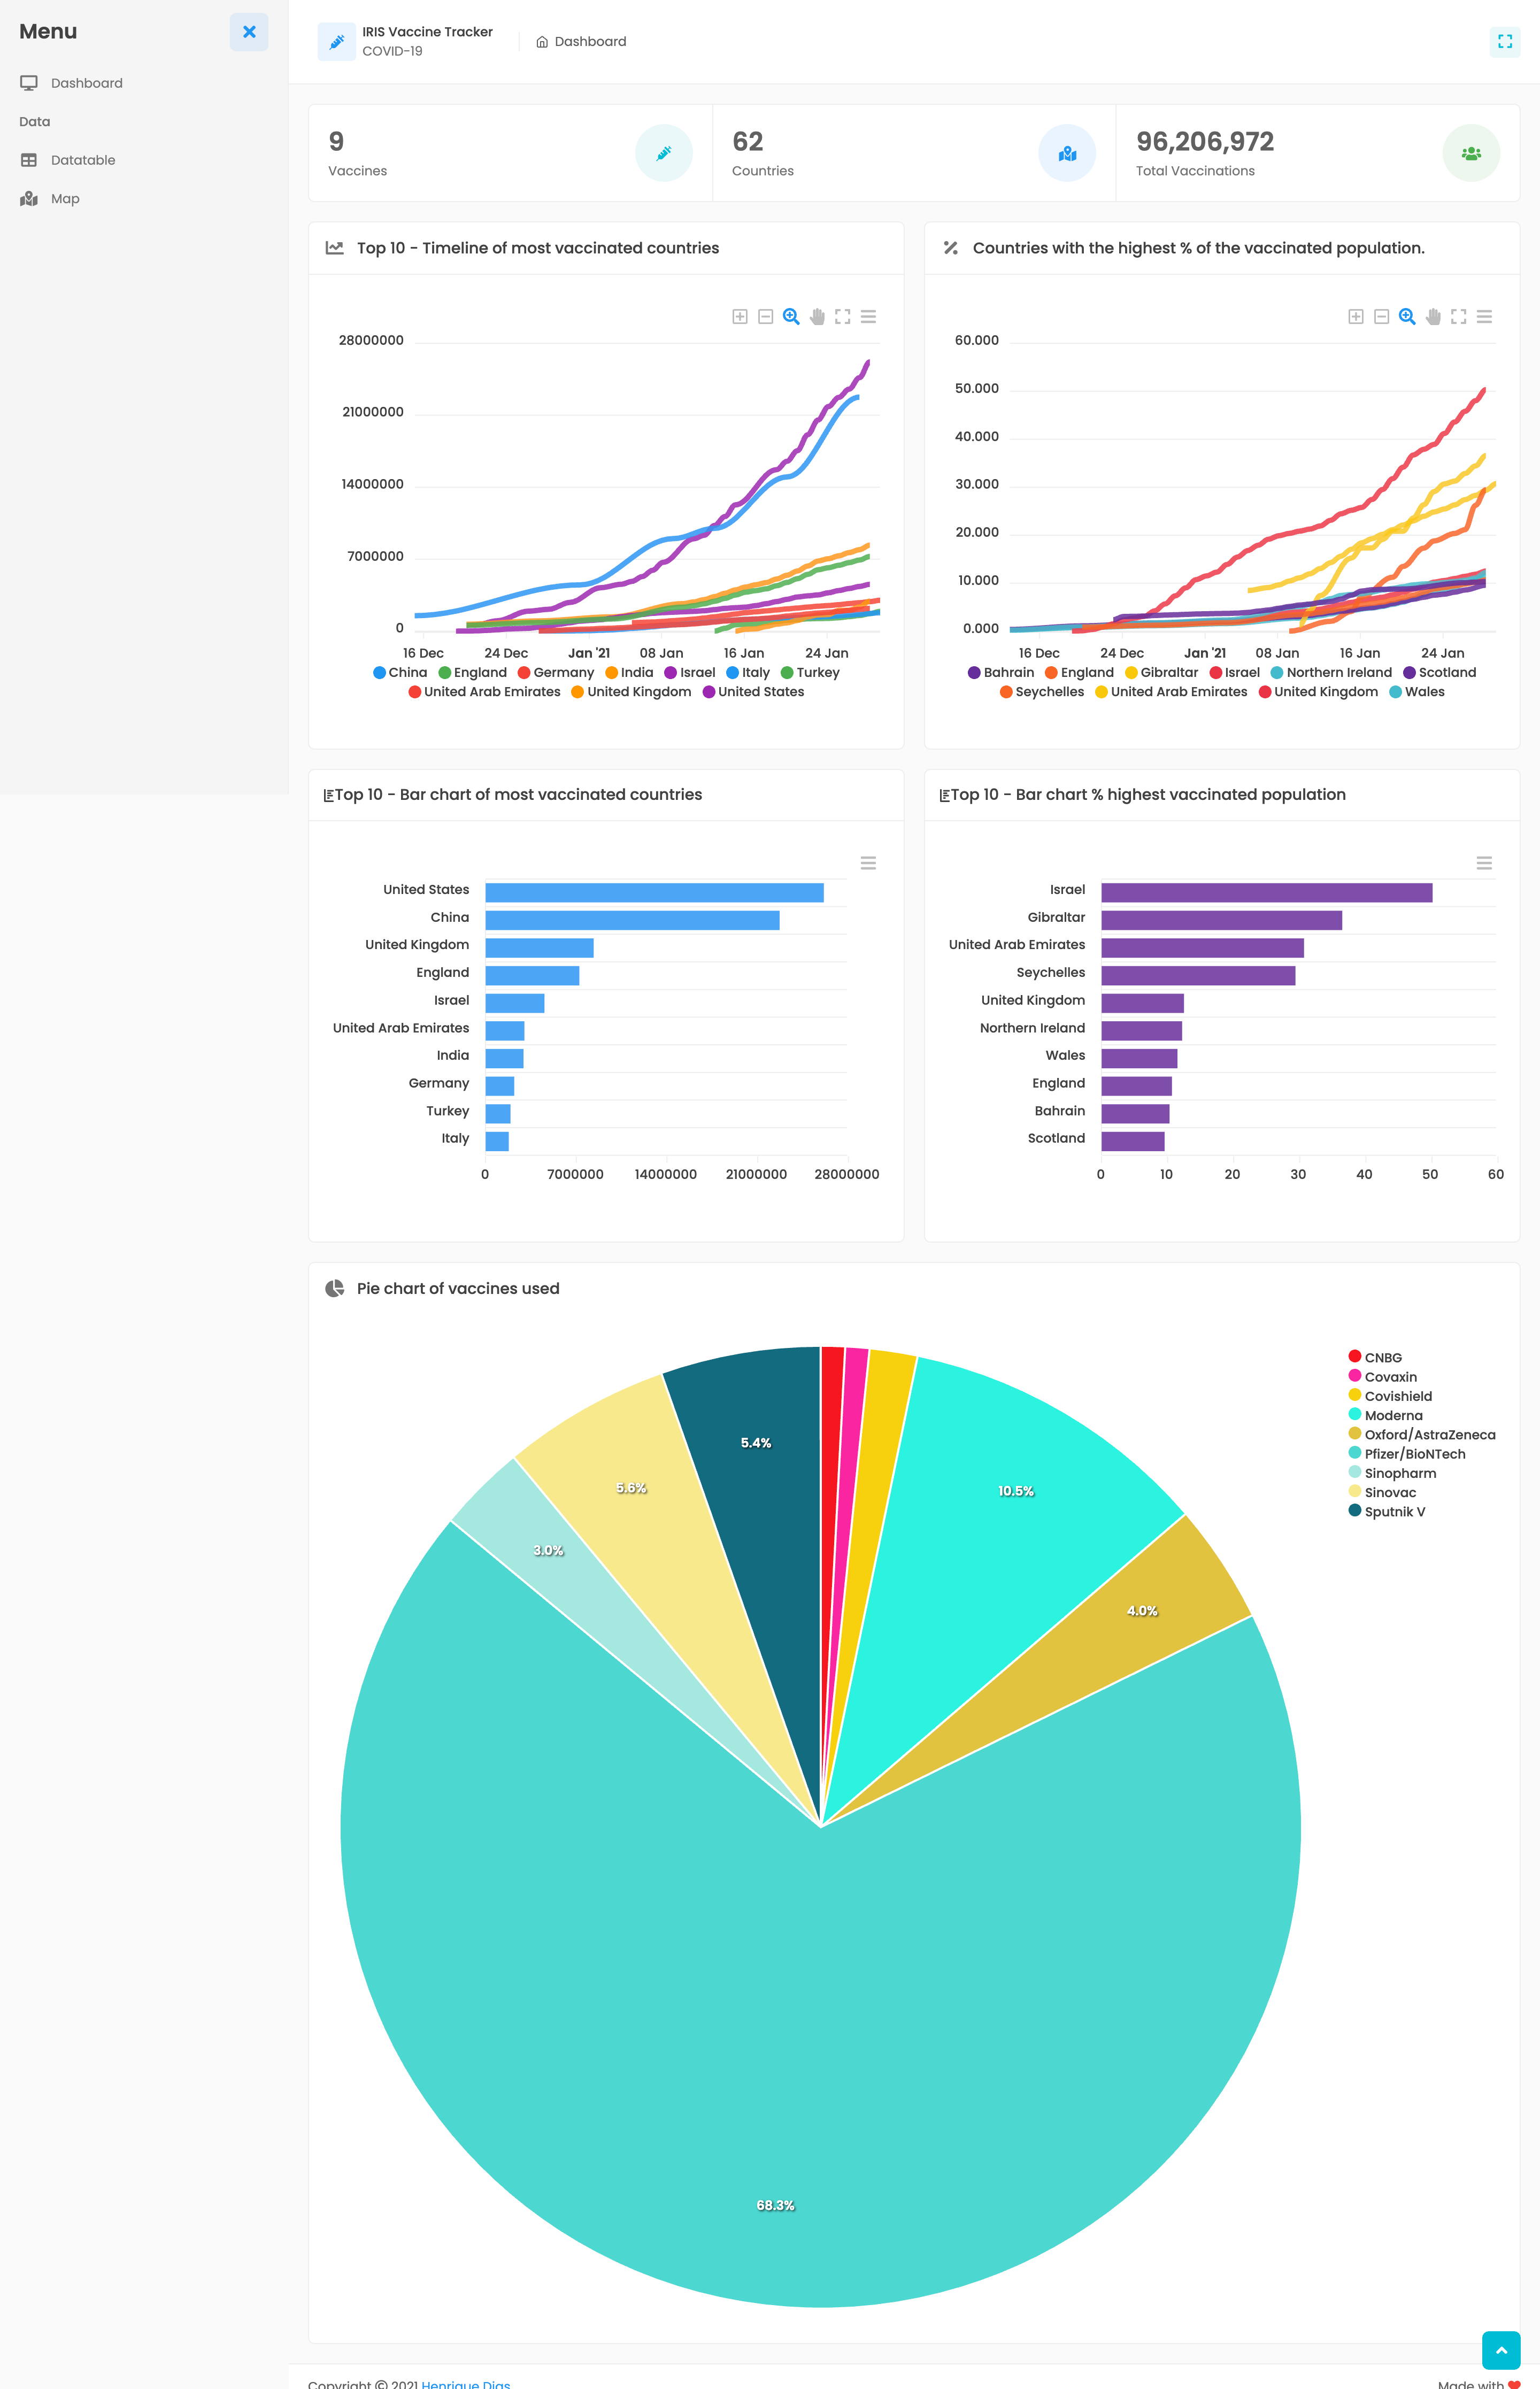
Main dashboard
The main dashboard provides a quick overview of the vaccination situation around the world.
The first widget offers the info about :
- How many vaccines are being used to vaccinate the population
- How many countries provide the info about vaccination
- Total of vaccinations applied so far.
The second widget gives us the timeline view of vaccination with the top 10 countries with the biggest vaccination numbers.
The third widget shows the timeline based on the top 10 countries with the highest percentage of their population vaccinated.
The fourth widget offers a bar chart with the top countries, showing the total vaccination so far.
The fifth widget offers a bar chart and listing the top 10 countries with the highest percent of the population vaccinated.
And the final widget, we have the distribution of vaccines, which vaccines are being used, and their percent of usage.
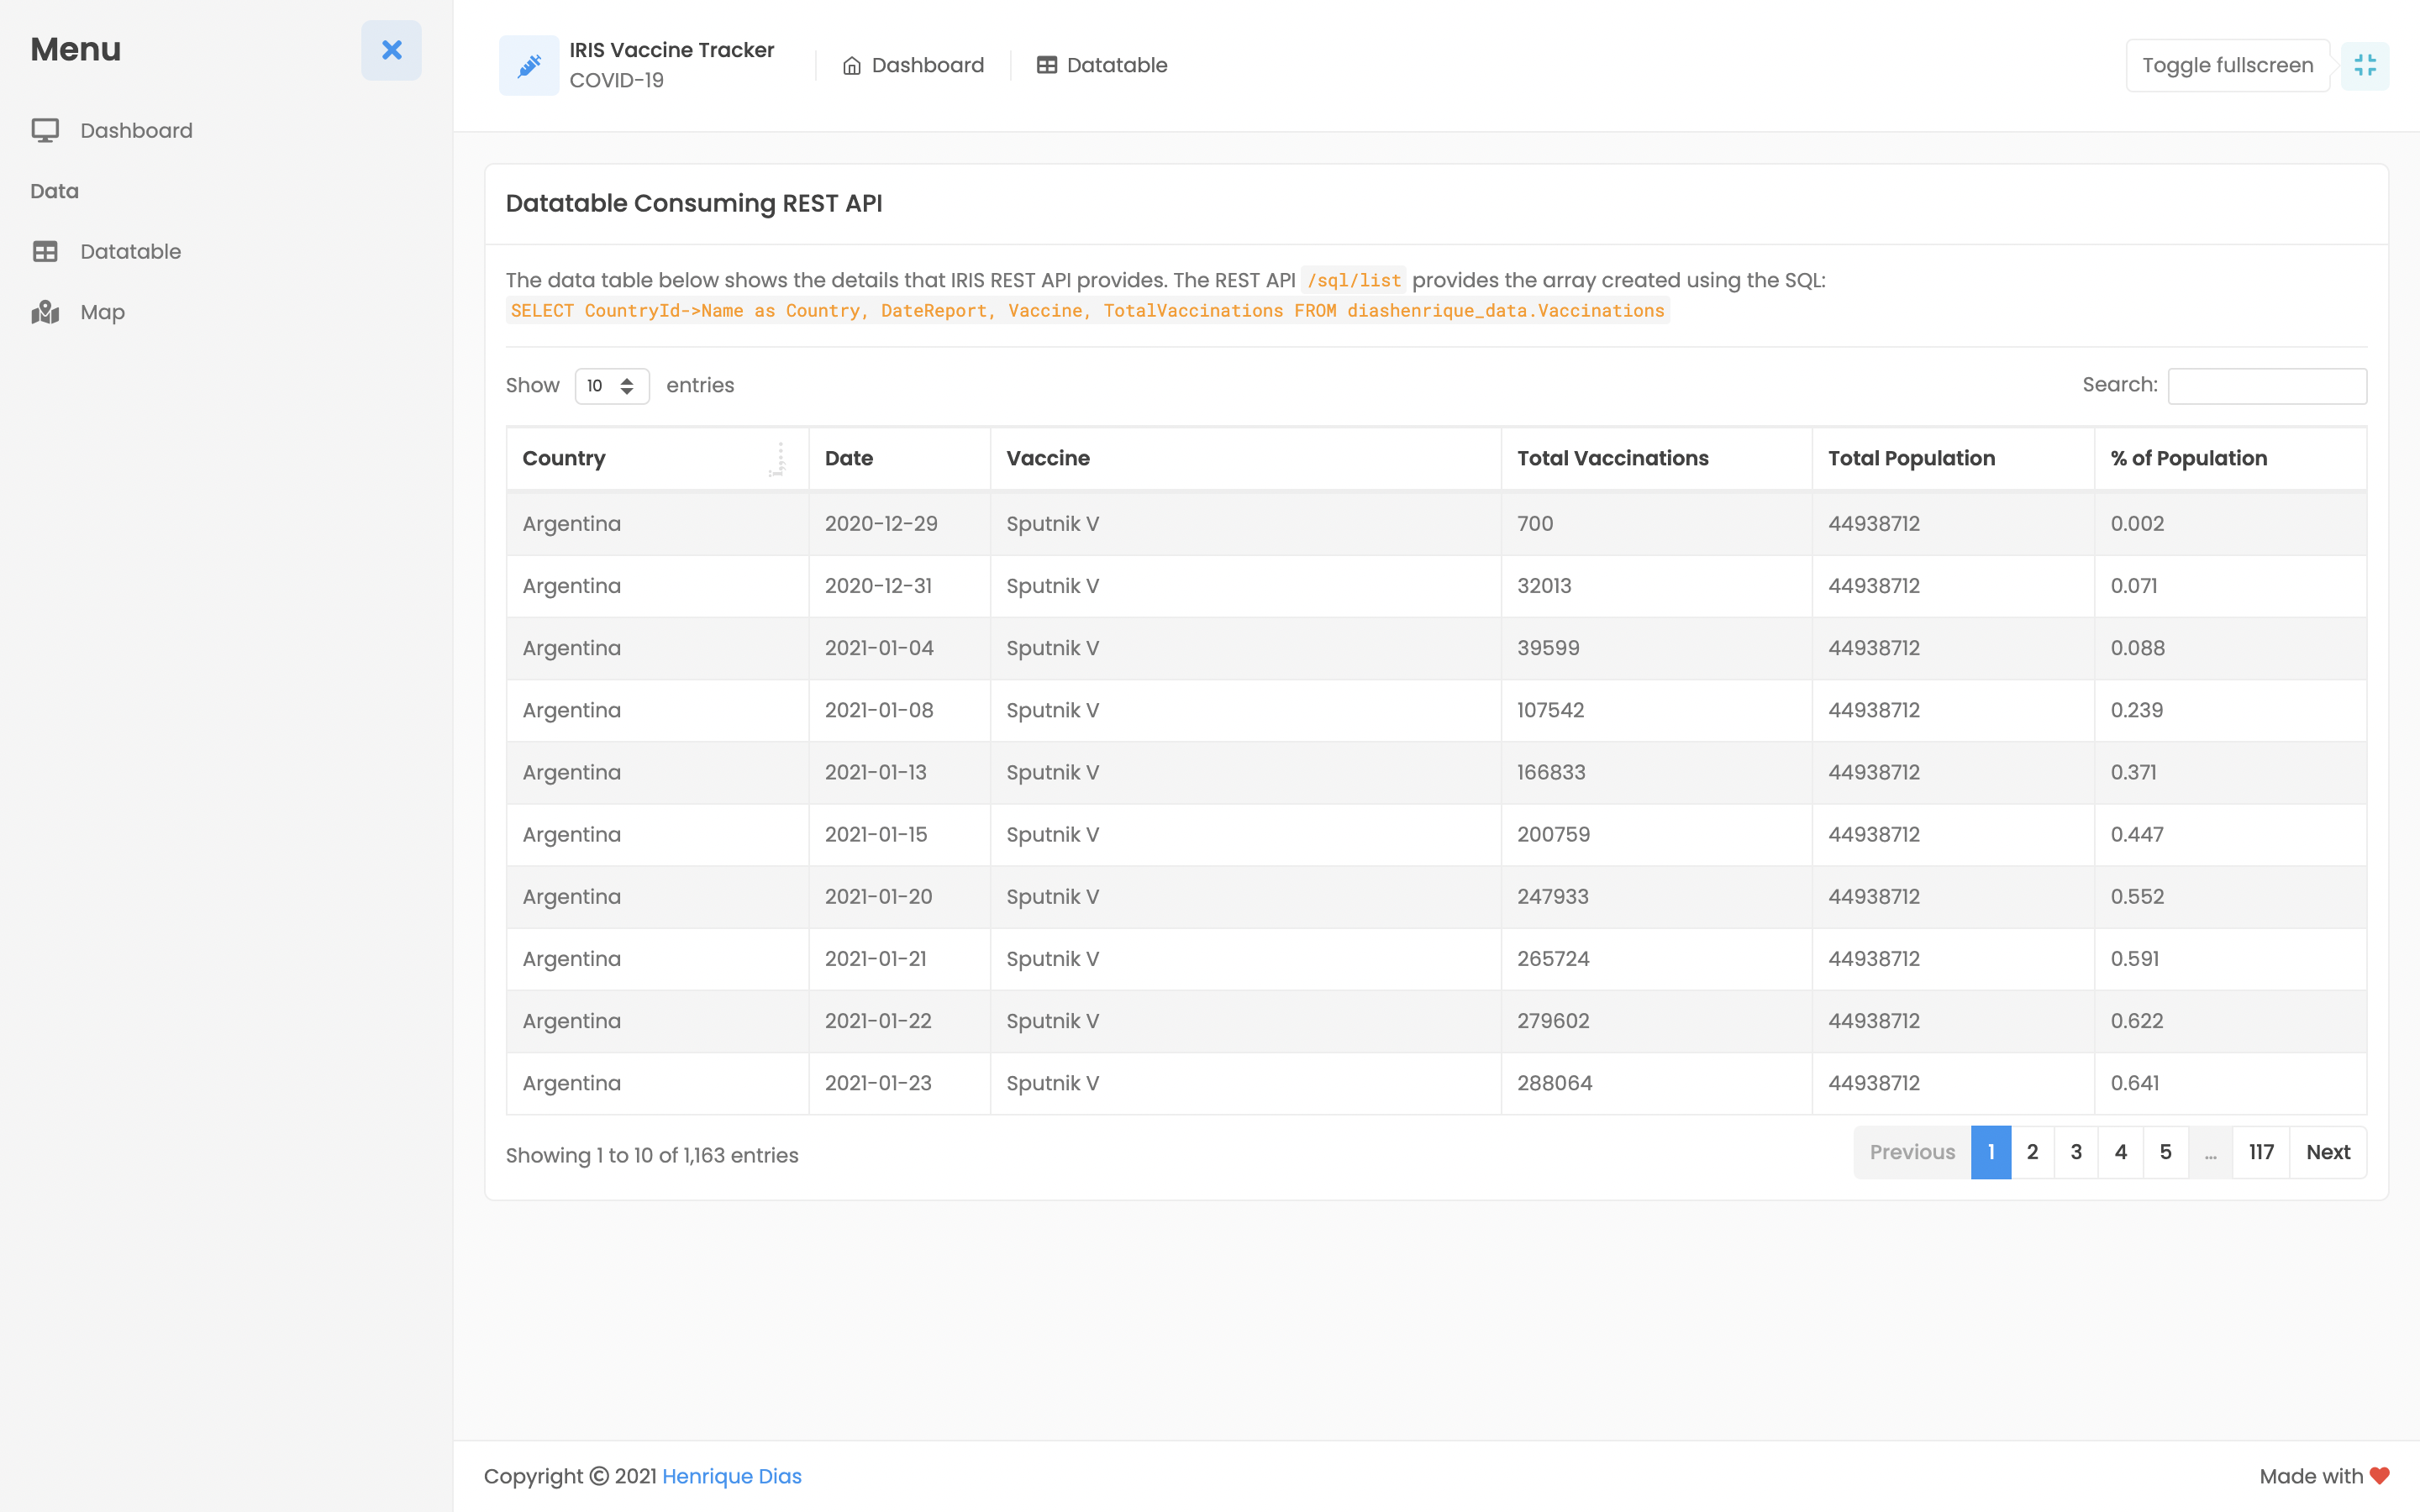
Datatable
The data table shows the detailed information that the main dashboard summarized.
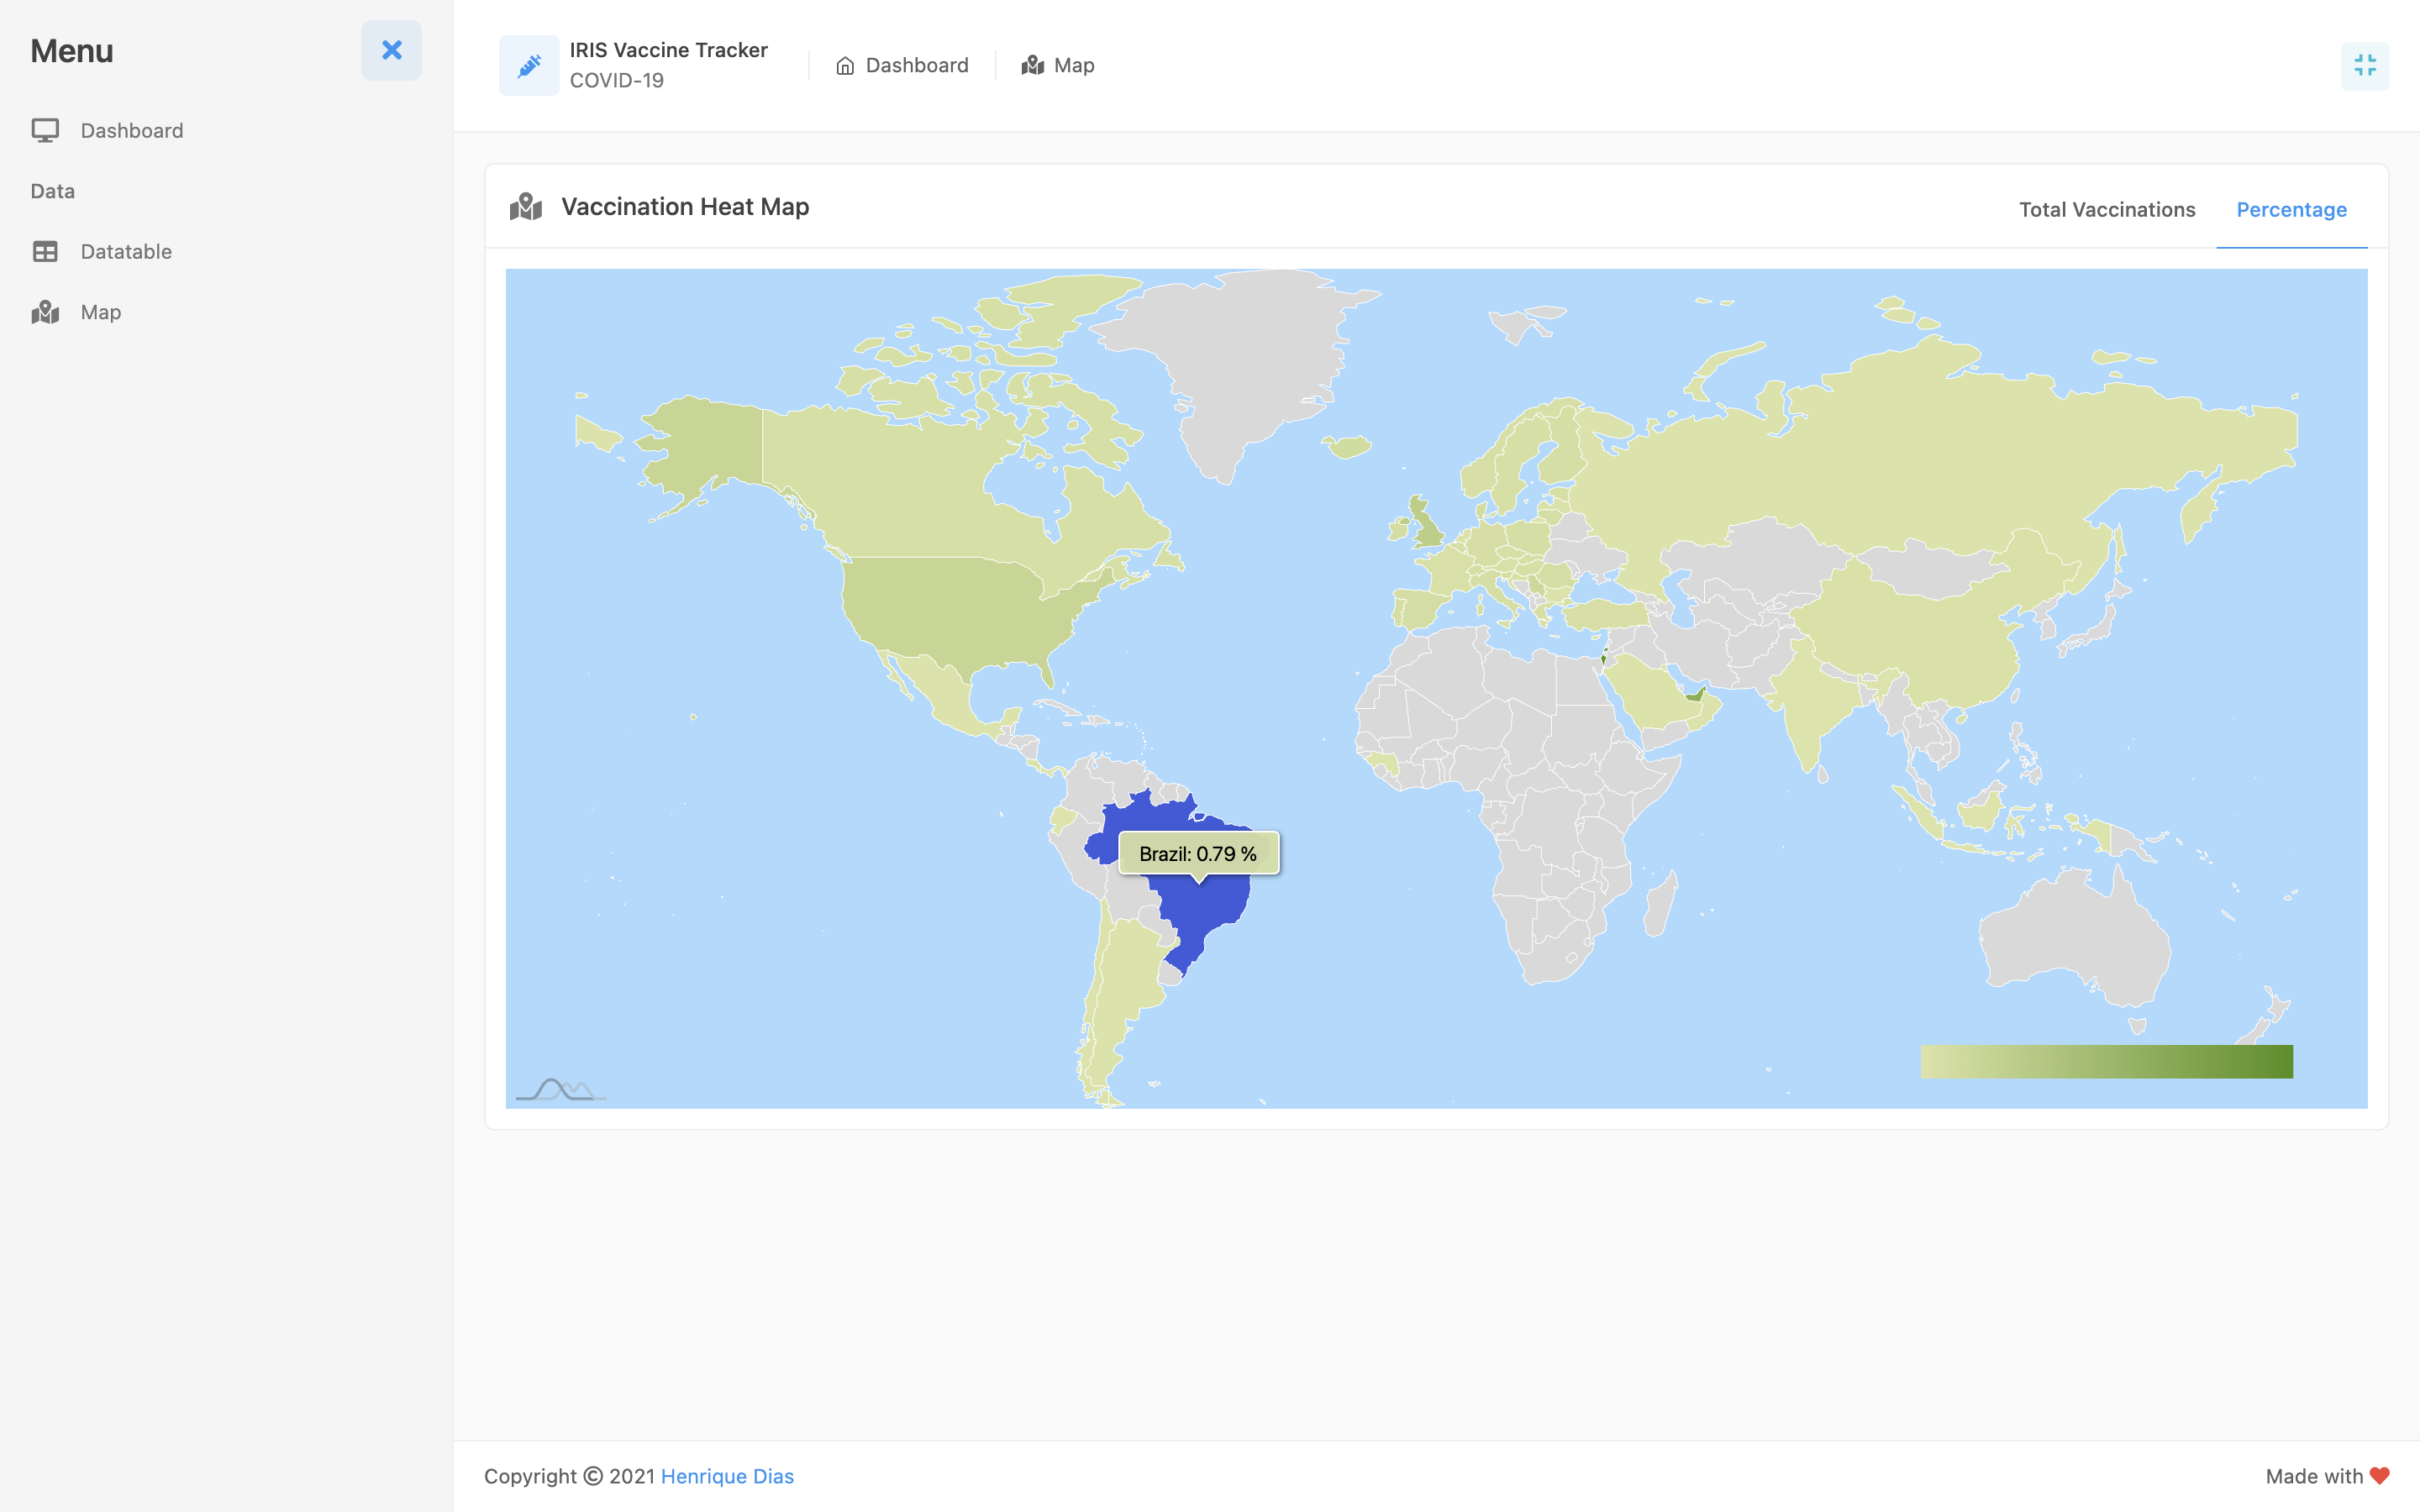
Vaccination Heat Map
The heat map is a different view using the info that we already used in the main dashboard, and datatable. But now using a detail provided by the Country persistent table. The ISO Code Alpha2, Country Name, and Value are used by the amCharts library to create this awesome chart.
The heat map has two tabs:
- The first one showing the total count of vaccinations from each country.
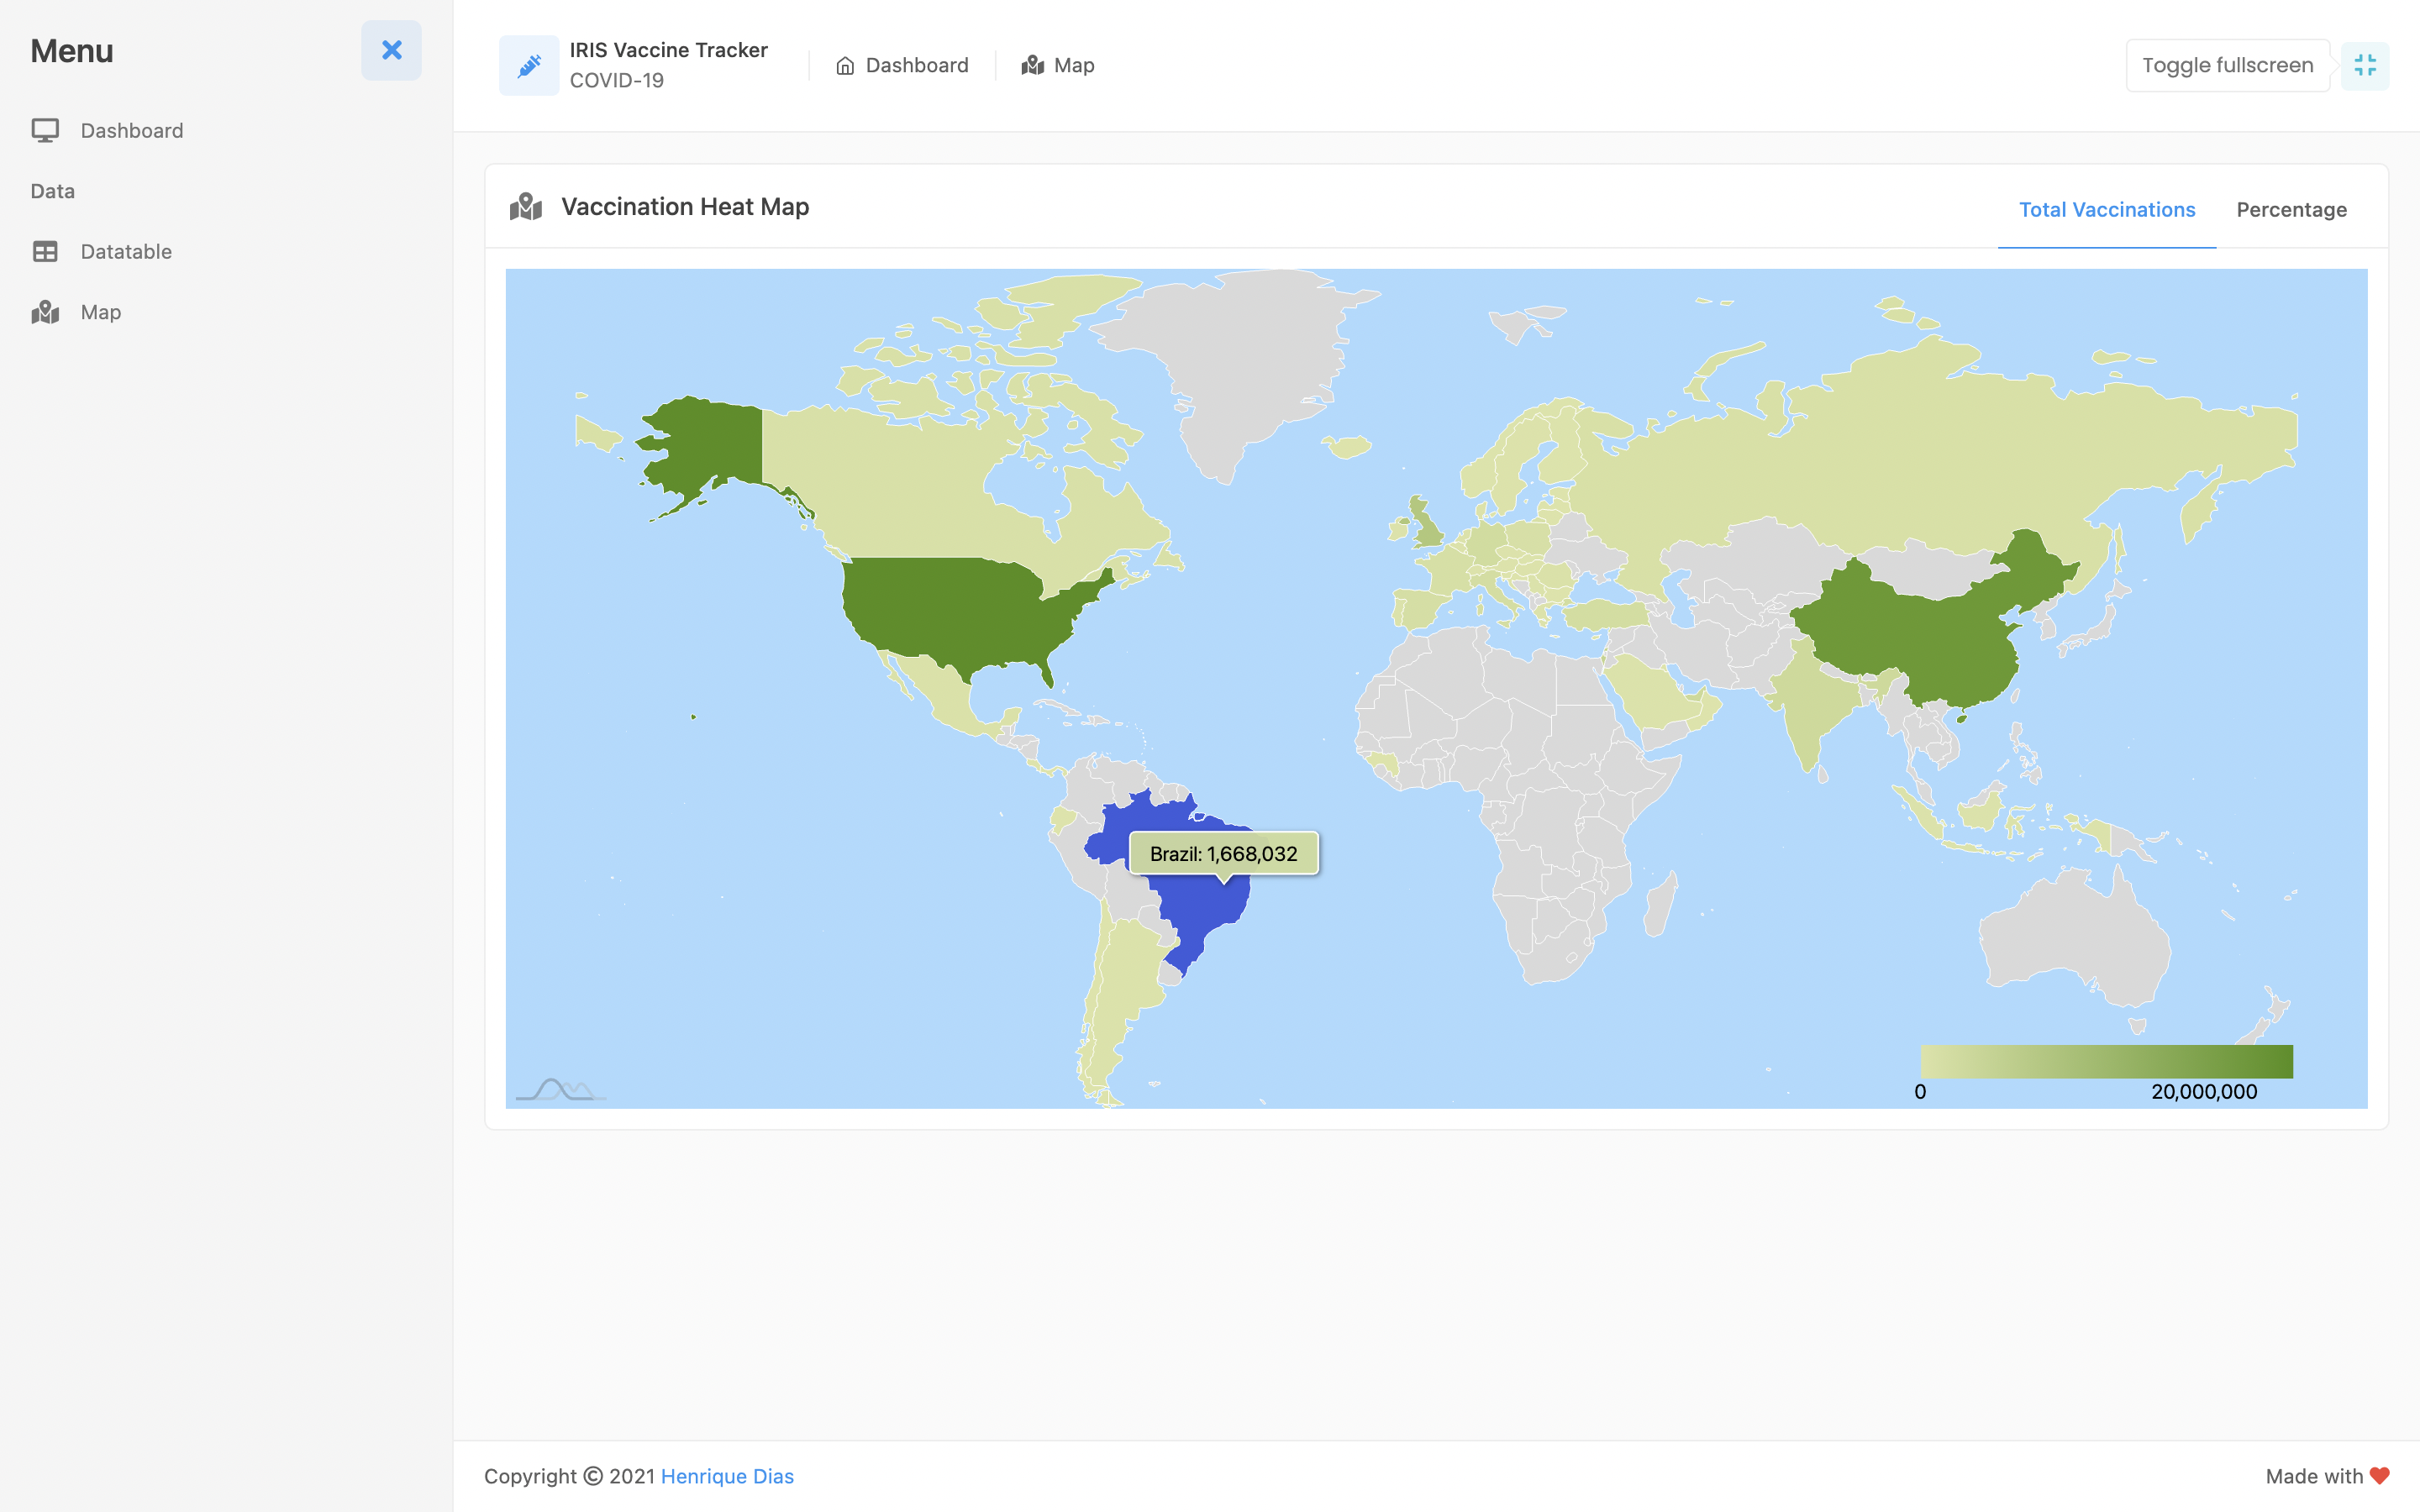
- The second heat map showing the total of vaccination, what it means in a percentage based on the population from each country.
Deployment to Cloud Run
Last checked by moderator
14 Nov, 2025Doesn't workMade with
Version
1.0.430 Jan, 2021
ObjectScript quality test
 PassedView report
Category
Works with
InterSystems IRISInterSystems IRIS for HealthFirst published
24 Jan, 2021Last edited
30 Jan, 2021