iris-integratedml-monitor-example  Status Unknown


 2
2 8
8
What's new in this version
Final version
iris-integratedml-monitor-example
This is an example of extending %Monitor.Adaptor to monitor IRIS IntegrateML models performance metrics, based on template for IntegratedML.
Please, checout these articles written based on this work:
- Why is COVID-19 also dangerous for Machine Learning? (Part I)
- Why is COVID-19 also dangerous for Machine Learning? (Part II)
Contents
- Prerequisites
- Tested environments
- Installation
- Monitoring your models
- What is IntegratedML?
- What’s IRIS System Monitor
- Data detalis
Prerequisites
Make sure you have git and Docker desktop installed.
About 6.5GB of free disk space availble.
Tested environments
This example was tested on Windows 10 and Docker 2.1. All commands was ran in Windows PowerShell.
Installation
Clone/git pull the repo into any local directory
$ git clone https://github.com/jrpereirajr/iris-integratedml-monitor-example.git
Go to the new directory
$ cd .\iris-integratedml-monitor-example\
Open a Docker terminal in this directory and run:
$ docker-compose build
Run the IRIS container, and Jupyter notebook server images:
$ docker-compose up -d
Start monitor on USER namespace.
If you get an error like ‘Sign-on inhibited: Startup or Installation in progress’, please, wait until IRIS instance complete its startup.
docker exec iris-integratedml-monitor-example_irisimlsvr_1 iris session IRIS -U USER '##class(MyMetric.IntegratedMLModelsValidation).Setup()'
Open browser to access the example notebook
http://localhost:8896/notebooks/IntegeratedML-Monitor-Example.ipynb
Note: use docker-compose ps to confirm tf2juyter’s ports; make sure right localhost port is used if over SSL tunneling to remotehost)
Monitoring your models
One of the features of IRIS IntegrateML is its easy deployment. I mean, if you have an IRIS database, technically you’re all set to start your machine learning (ML) model, based on the most used tools available today. And once your database is deployed, your ML model are deployed automatically.
However, this isn’t the whole story. Your deployed models need to be periodically monitored to ensure their reliability. If their performance becomes unacceptable, they need to be retrained.
Fortunately, IRIS also provides tools for system monitoring - called IRIS System Monitor.
In this work, an user-defined application monitor will be written in order to monitor IntegrateML models performance.
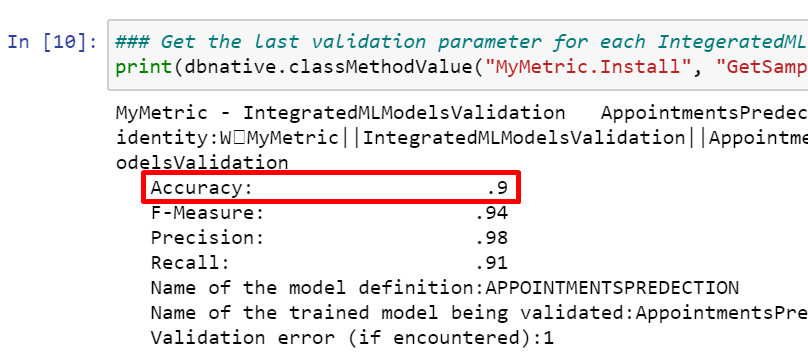
For instance, let’s say after you trained your model you achieve 90% of accuracy, and you consider this value as the minimum acceptable. The application monitor developed here show us this value, as we can see in the below.

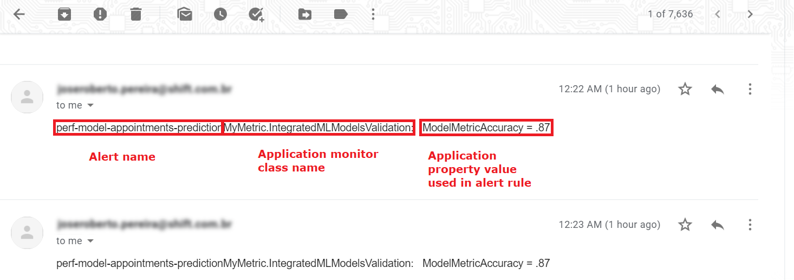
Now, imagine after a while, new records introduce noise into your data in such way that model’s performance descrease to 87%. You can setup an alert using application monitor data, defining a rule to trigger it, if accuracy metric is below 90%, and an e-mail is sent to someone who could take some action in order to restore model’s performance to an acceptable level.

In e-mail body, you could find information about the alert, such its name, application monitor and its metrics values that triggered the alert.

This scenario is simulated into a notebook provided in this exaple. Please, after proceed with instalation, check this out to see how you can do it.
In the next sections some information is given on tecnologies and data used in this example for context purposes. An instalation guide is provided as well.
What is IntegratedML?
Note: took exactaly as described here
IntegratedML is a feature of the InterSystems IRIS data platform that brings machine learning to SQL developers.
IntegratedML is
- all-SQL – Build and train machine learning models using intuitive custom SQL commands, fully integrated within the InterSystems IRIS SQL processor
- turnkey – no packages or programming languages to learn, nothing to install
- modular – leverages “best of breed” open source and proprietary AutoML frameworks
Learn more about InterSystems IRIS and IntegratedML at the InterSystems Learning site
What’s IRIS System Monitor
InterSystems IRIS provides the System Monitor framework to provide monitoring task on system metrics and trigger notifications based on predicates applied on such metrics. System Monitor also let you to extend built-in monitors to cover a endless possibilities.
You can get more information on System Monitor here.
Data detalis
In this work an open dataset with +60K medical appointments is used to train a show/no-show prediction model and simulate a performance issue which can be detected by an application monitor.
The dataset was grabbed from Kaggle platform and more information about this dataset could be acquired here.

