© 2025 InterSystems Corporation, Cambridge, MA. All rights reserved.Privacy & TermsGuaranteeSection 508Contest Terms

iris-history-monitor

4.17
3 reviews
2
Awards
2.1k
Views
106
IPM installs
 1
1 22
22
Details
Releases (4)
Reviews (3)
Awards (2)
Issues
Articles (2)
IRIS History Monitor - For InterSystems IRIS is now available in Package Manager and using IRIS 2019.4 API and WS
What's new in this version
Build failed - bug fixed
IRIS History Monitor
This personal project has the intention to show in a visual way the information generate by the System Monitor ^%SYSMONMGR and a different approach for the System Dashboard and System Processes.
How to Run
To start coding with this repo, you do the following:
- Clone/git pull the repo into any local directory
$ git clone https://github.com/diashenrique/iris-history-monitor.git
- Open the terminal in this directory and run:
$ docker-compose build
- Run the IRIS container with your project:
$ docker-compose up -d
How to test
Open the browser and go
Ex.: http://localhost:52773/csp/irismonitor/dashboard.csp
The username _SYSTEM can run the dashboard and the other features.
System Dashboard
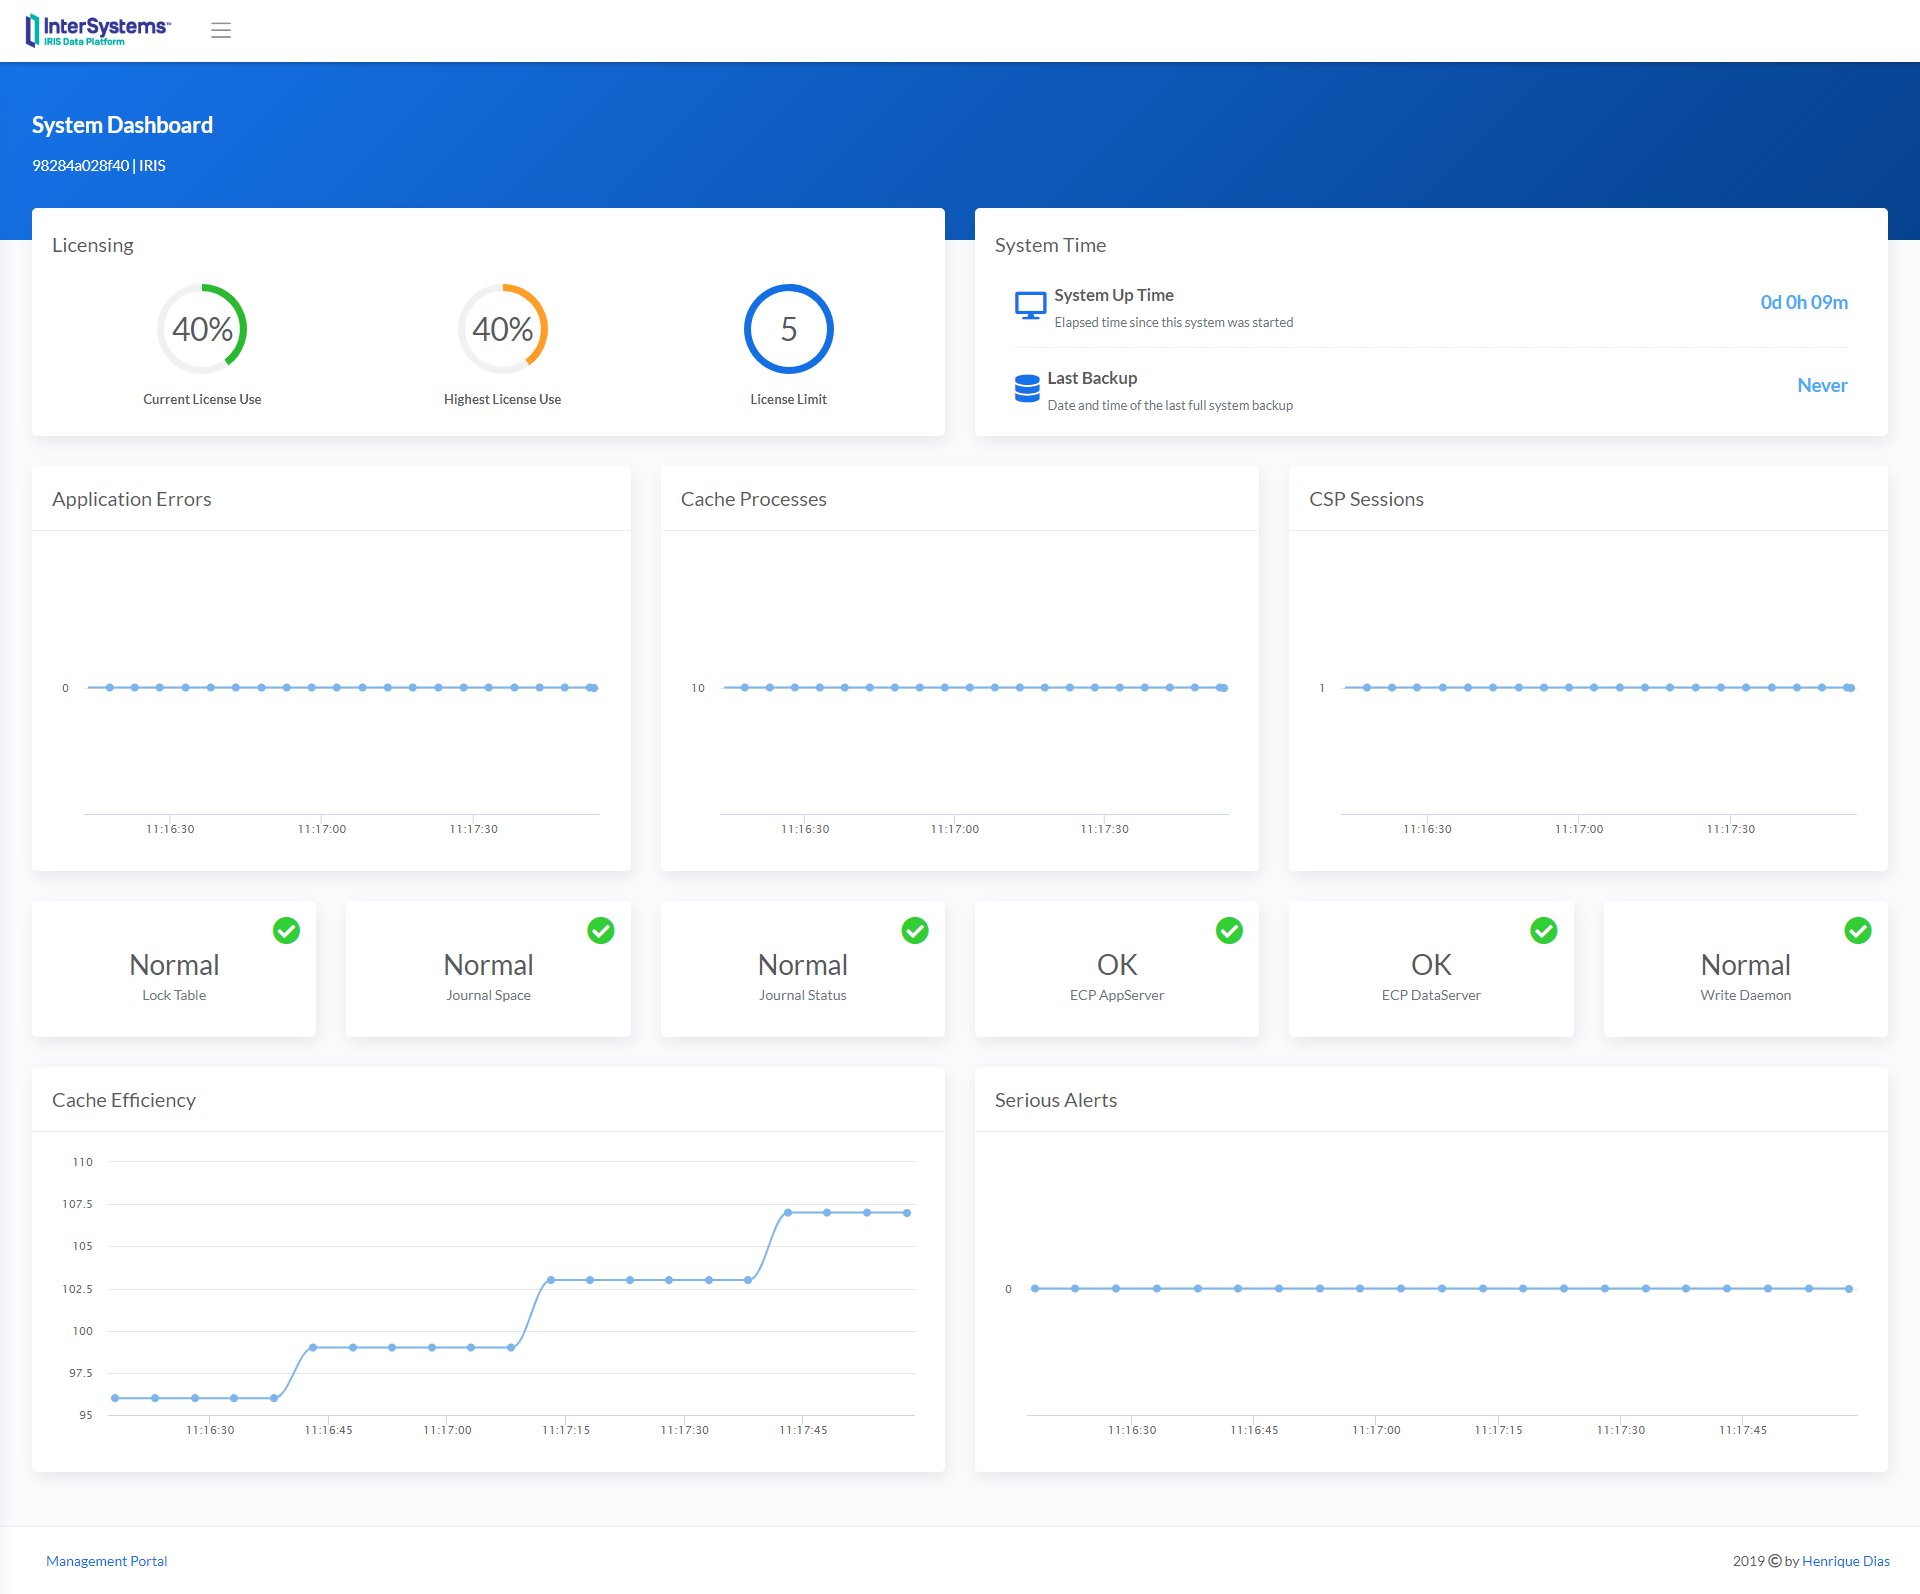
System Dashboard shows the following items:
- Licensing
- System Time
- Application Errors
- Cache Processes
- CSP Sessions
- Lock Table
- Journal Space
- Journal Status
- ECP AppServer
- ECP DataServer
- Write Daemon
- Cache Efficiency
- Serious Alerts
The line charts widgets plot a point every 5 seconds
System Menu
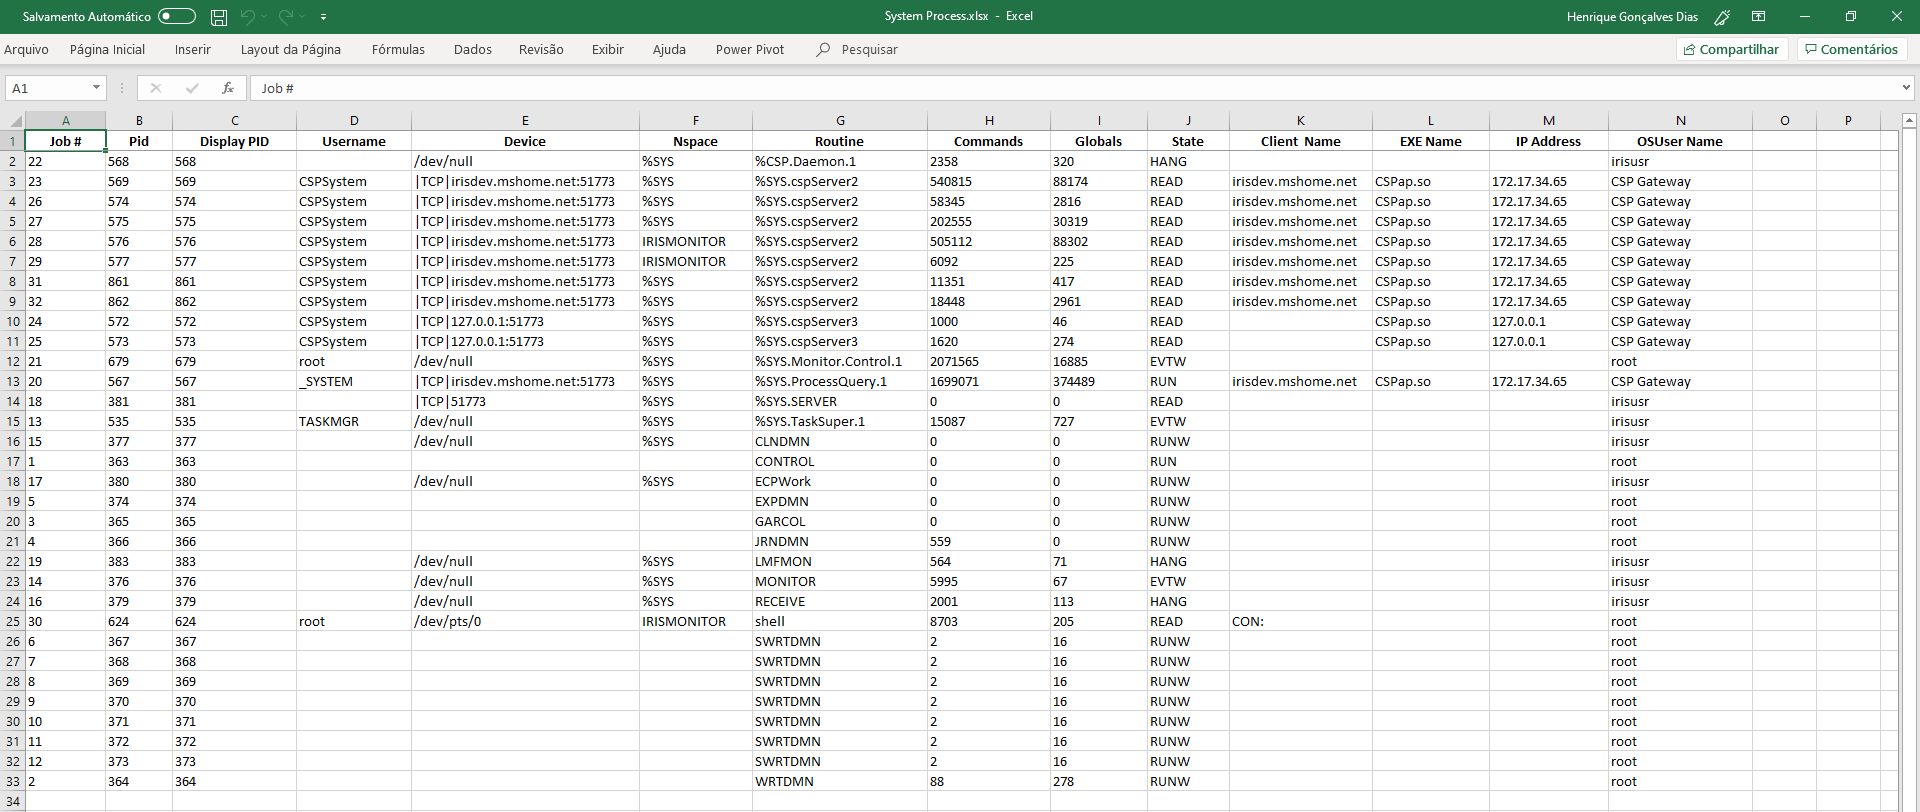
System Processes
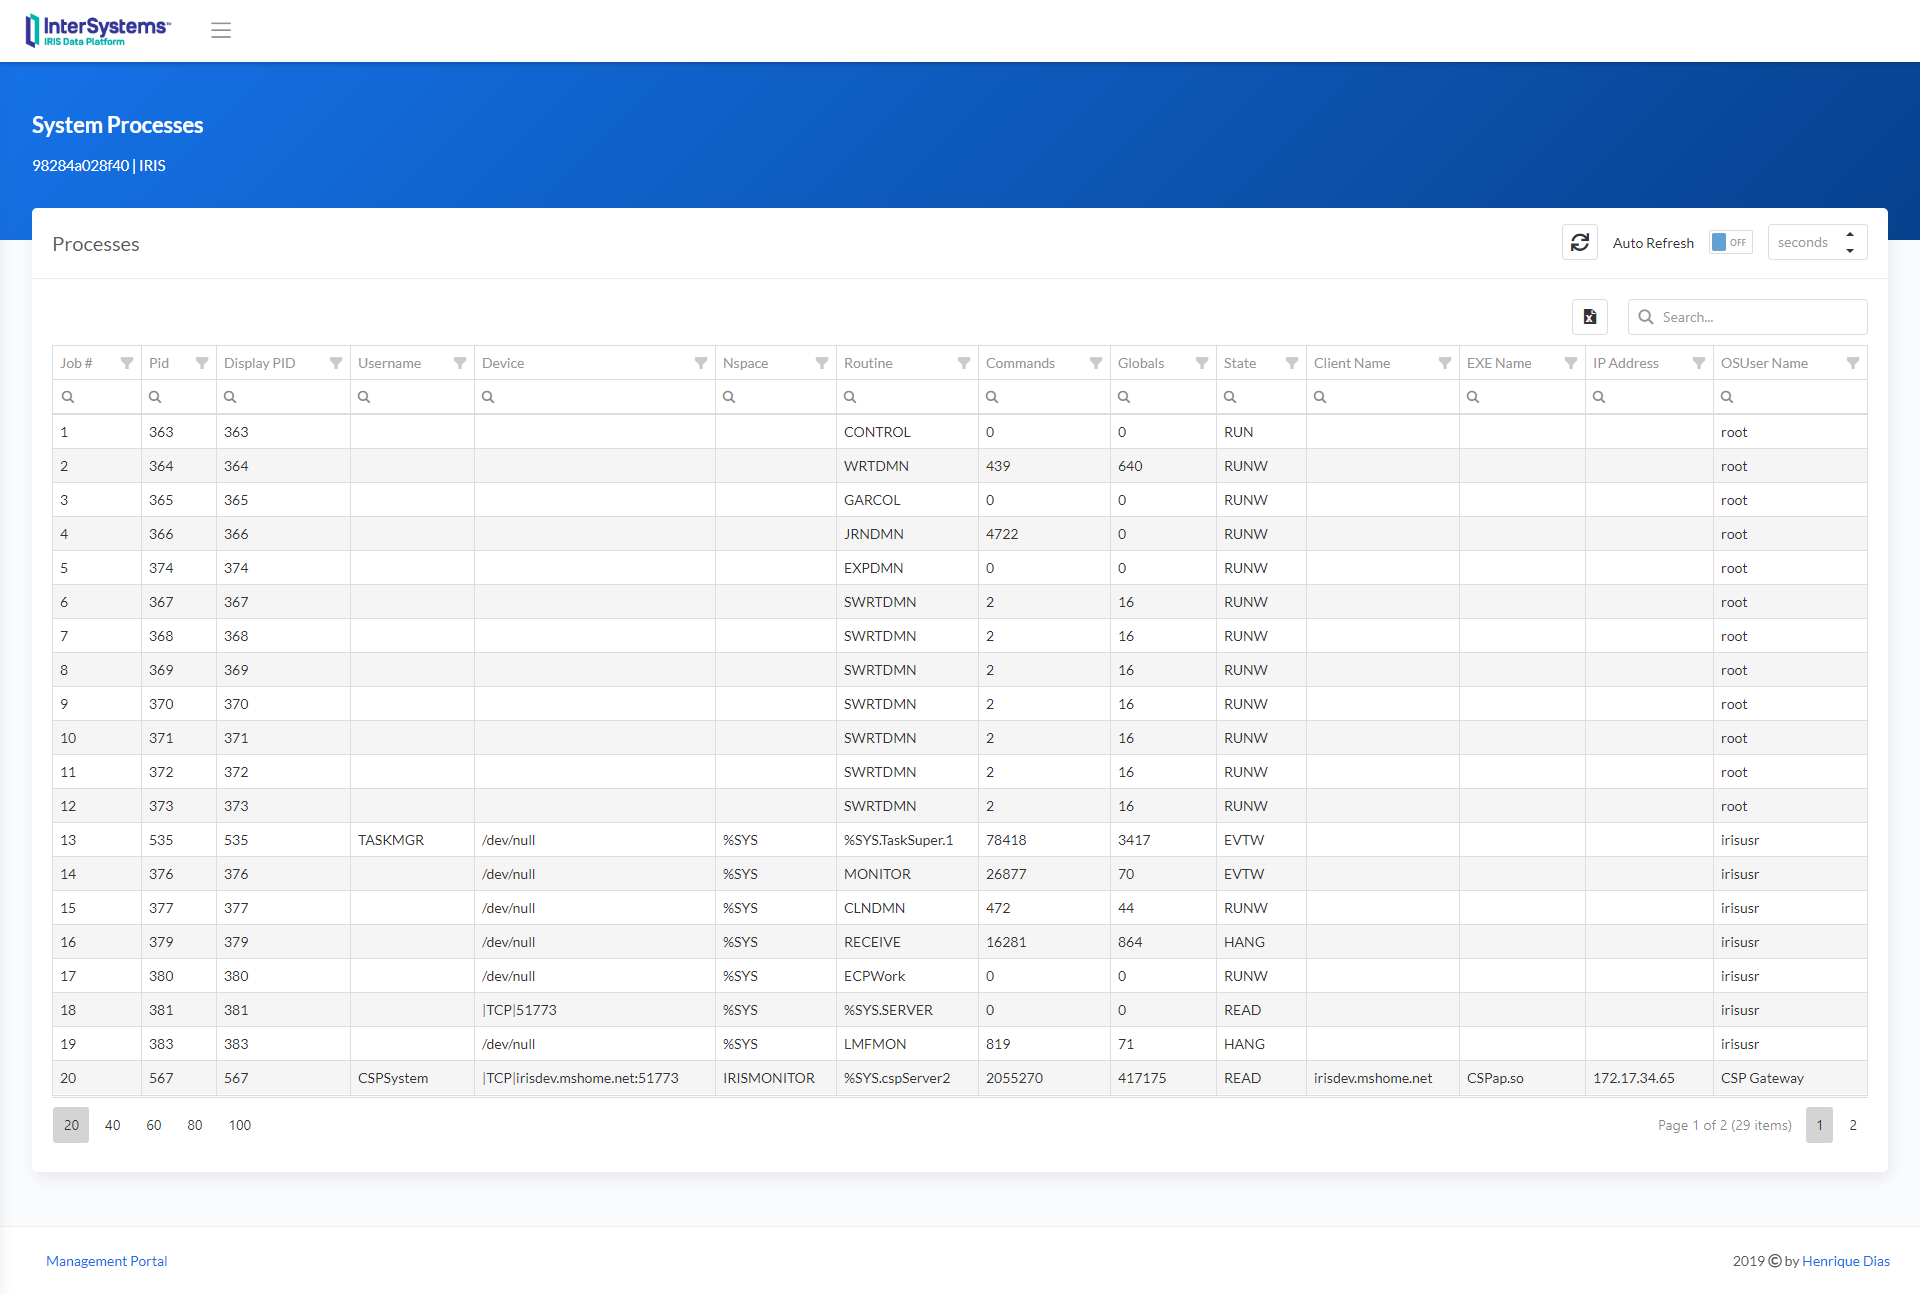
Processes Filters
Use different filters to achieve the result that you need. You can also use Multiple Sorts, pressing Shift + clicking on the column header. and even export the data grid to Excel!
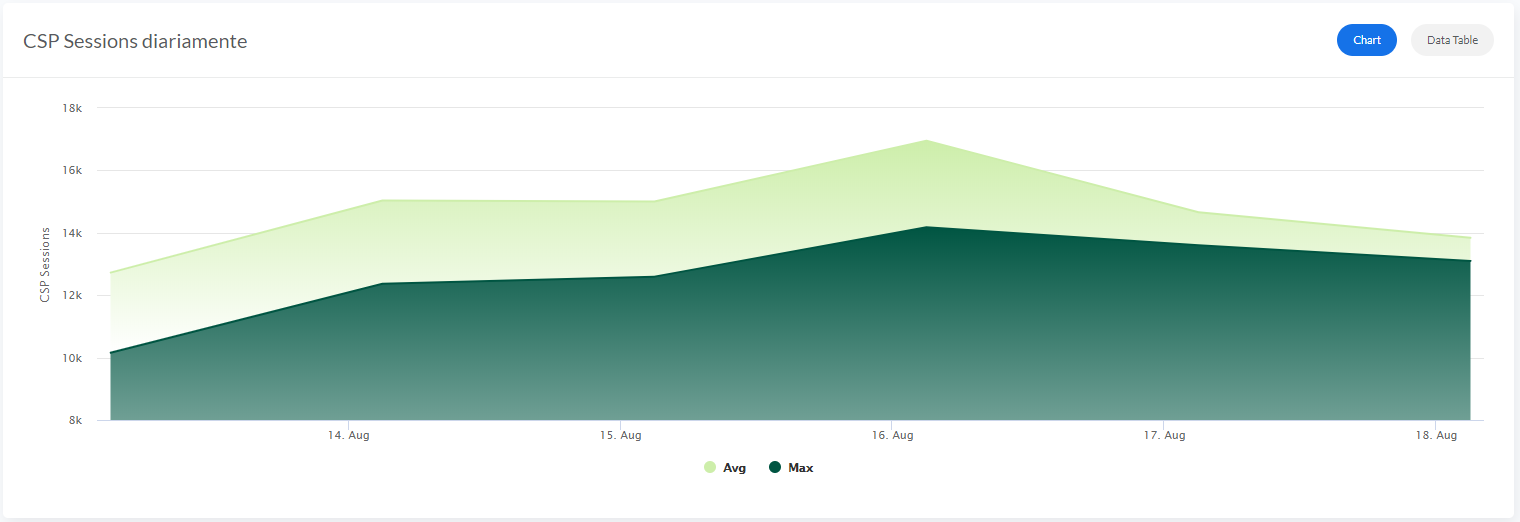
History Monitor
The History Monitor for CSP Sessions and Licensing shows the information between three sections:
- Every 5 Minutes
- Daily
- Hourly
Database Growth only shows Daily information.
The history pages share the features below:
Date Range Picker
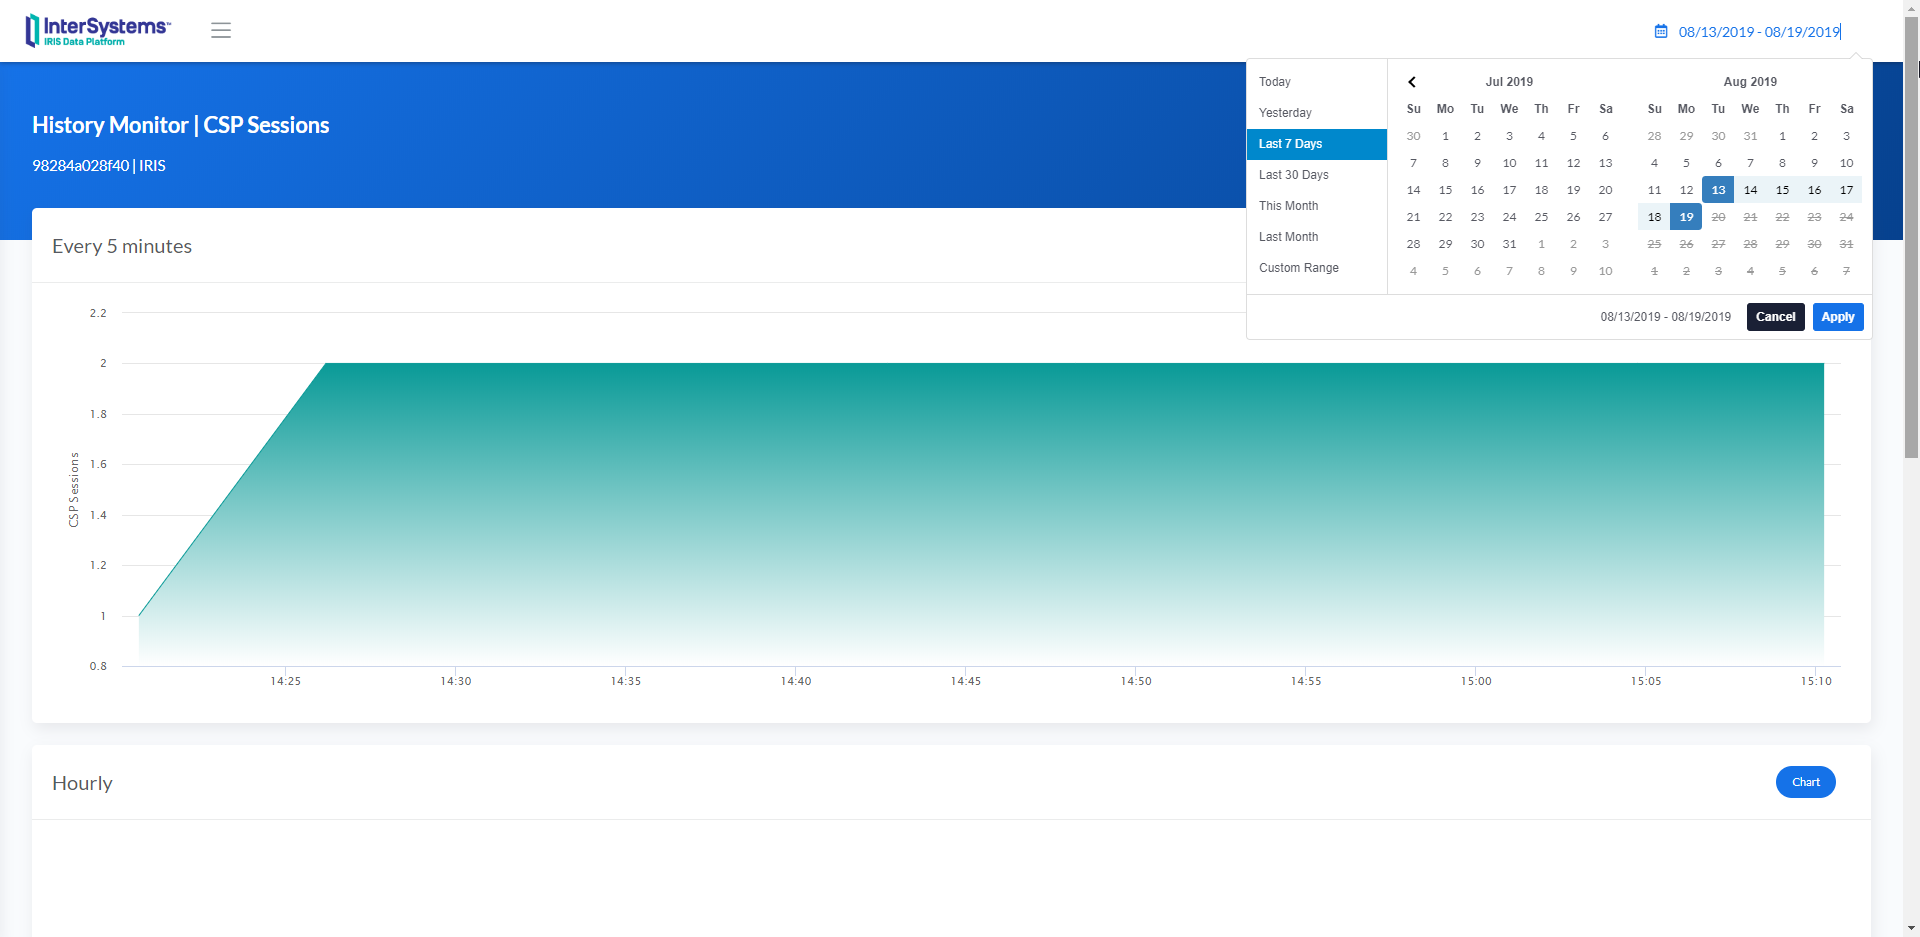
The default value is “Last 7 Days.”
Chart / Data Table
On the top right of every each section, there are two buttons (Chart/Data Table)
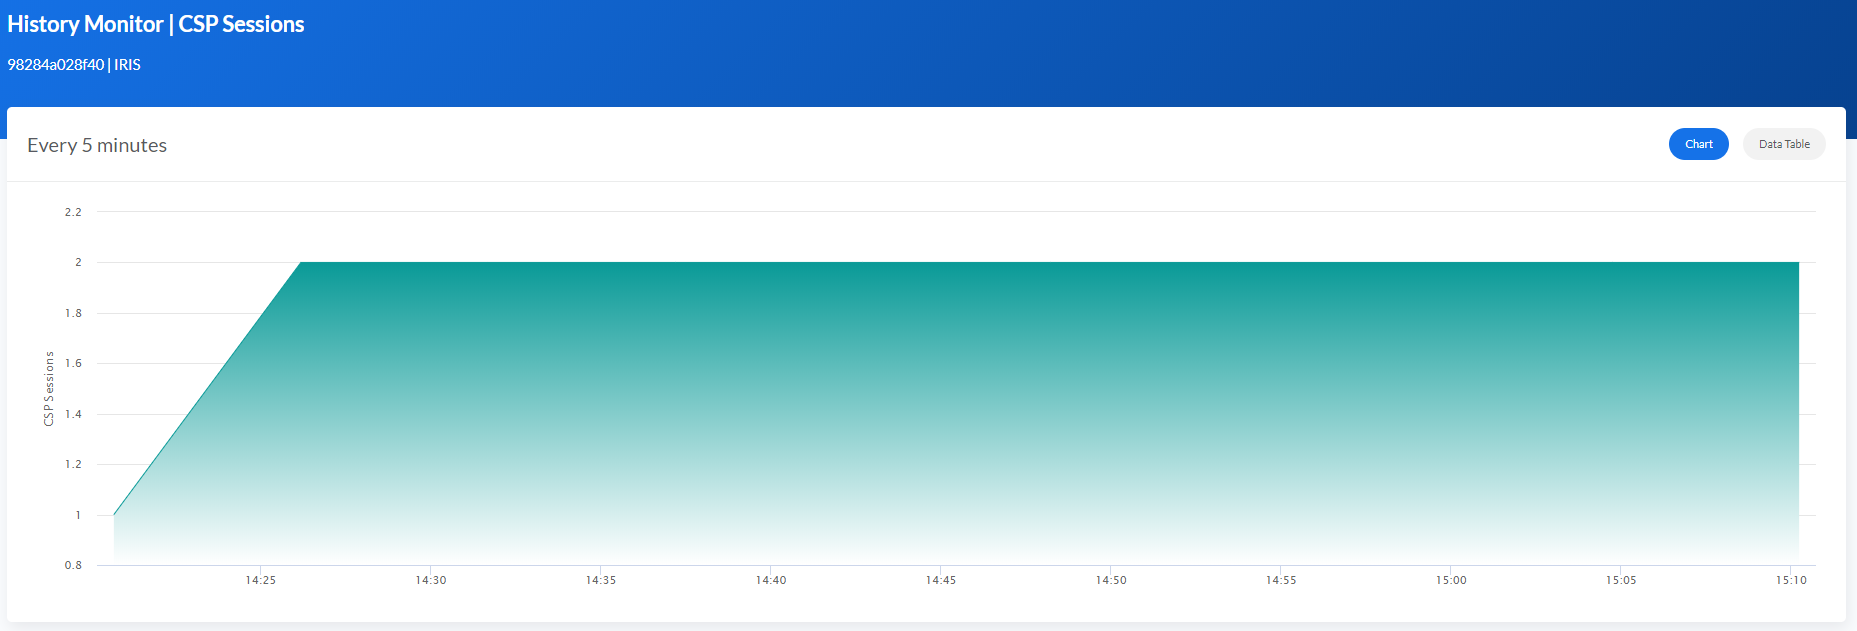
The Data Table shows the information that creates the chart, and you can also download in excel format.
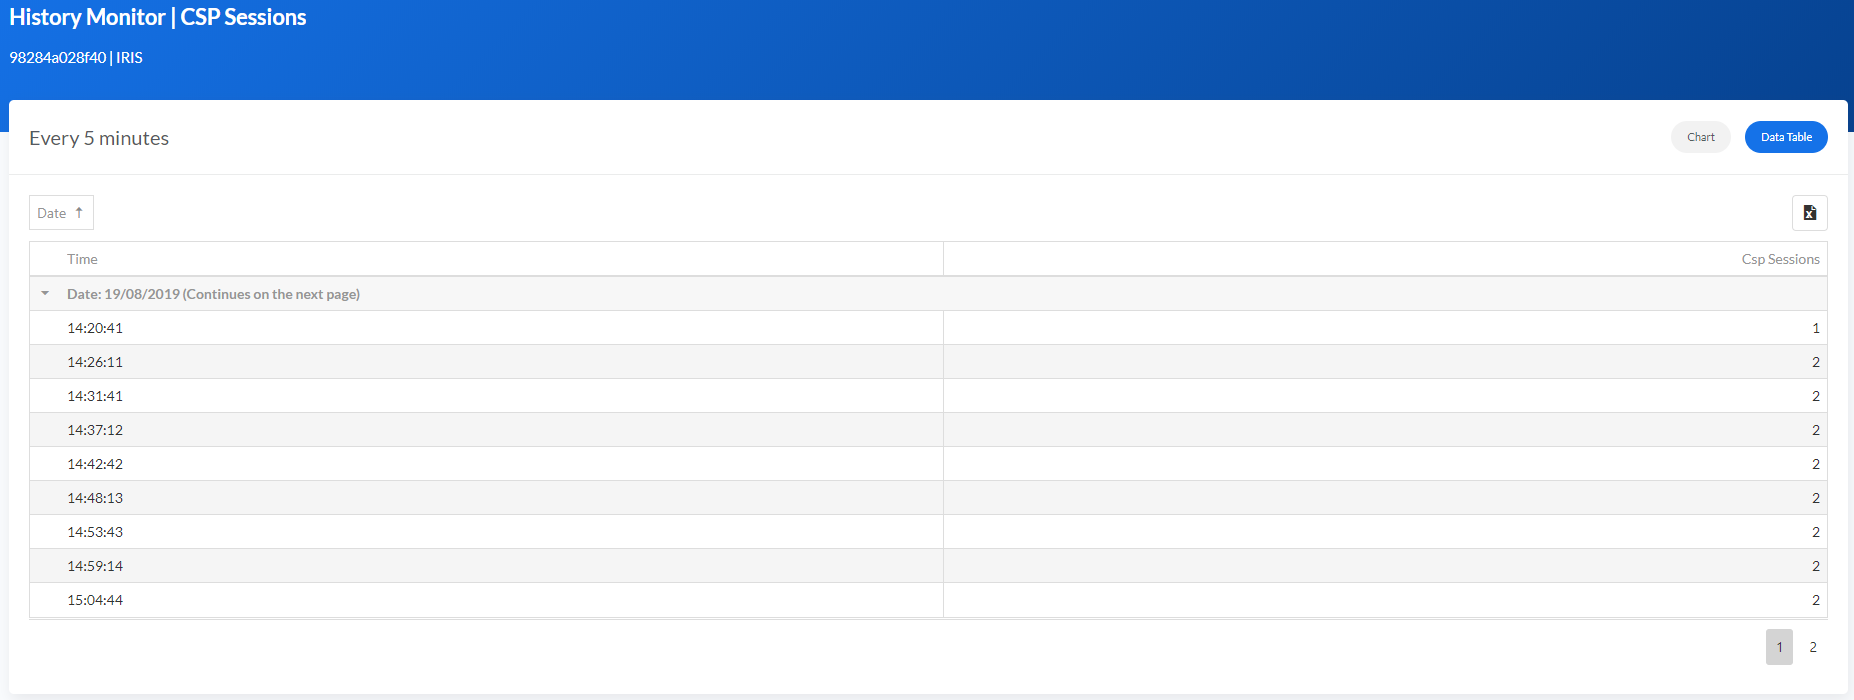
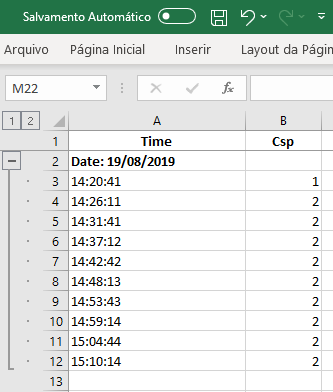
The excel shows the same format, content, and group defined in the CSP.
Zooming
All charts have the Zoom option to visualize the information with more details.
Average and Maximum
For the Sections Hourly and Daily, the charts show Average and Maximum values.
AVG
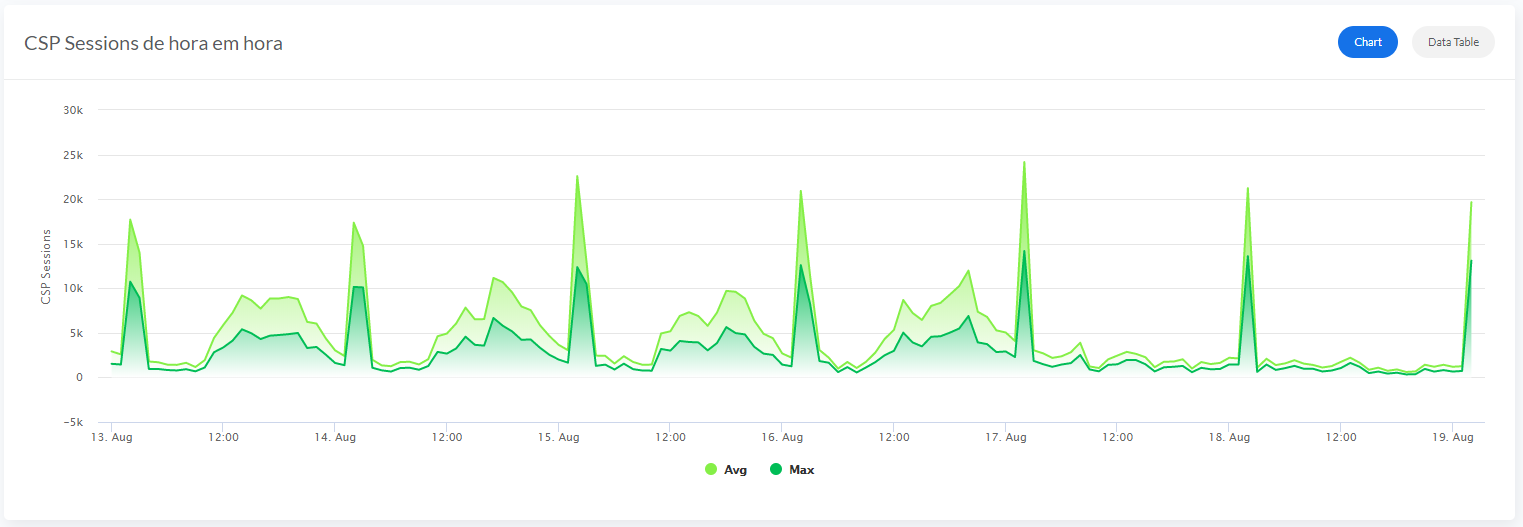
Max
Other information
The project was created as a Technology Example using the possibilities provided by InterSystems IRIS.
The library used for this demo, DevExtreme, it’s free to use and to develop non-commercial applications.
For specific feature availability and license restrictions, please, visit the website to the product feature comparison, and the DevExtreme Non-Commercial, Non-Competitive License Agreement, respectively.
Made with
Install
 zpm install iris-history-monitor
  download archive
 Version
1.2.415 May, 2022
Category
Works with
CachéEnsembleInterSystems IRISFirst published
20 Aug, 2019Last edited
15 May, 2022Last checked by moderator
08 Feb, 2025Works