
iris-fhir-portal  Issue Detected


 1
1 10
10
What's new in this version
Automatic version update
IRIS FHIR Portal
The goal is to show how easy we can create a Patient Chart using FHIR capabilities in IRIS For Health and also empower the user with their own data.
Prerequisites
Make sure you have git and Docker desktop installed.
Installation
Clone/git pull the repo into any local directory
$ git clone https://github.com/diashenrique/iris-fhir-portal.git
Open the terminal in this directory and run:
$ docker-compose up -d
Installation via IPM
zpm "install fhir-portal"
After installation open the URL:
your-server:port/fhir/portal/patientlist.html
Testing the FHIR Application
Open URL http://localhost:32783/csp/user/fhirUI/patientlist.html
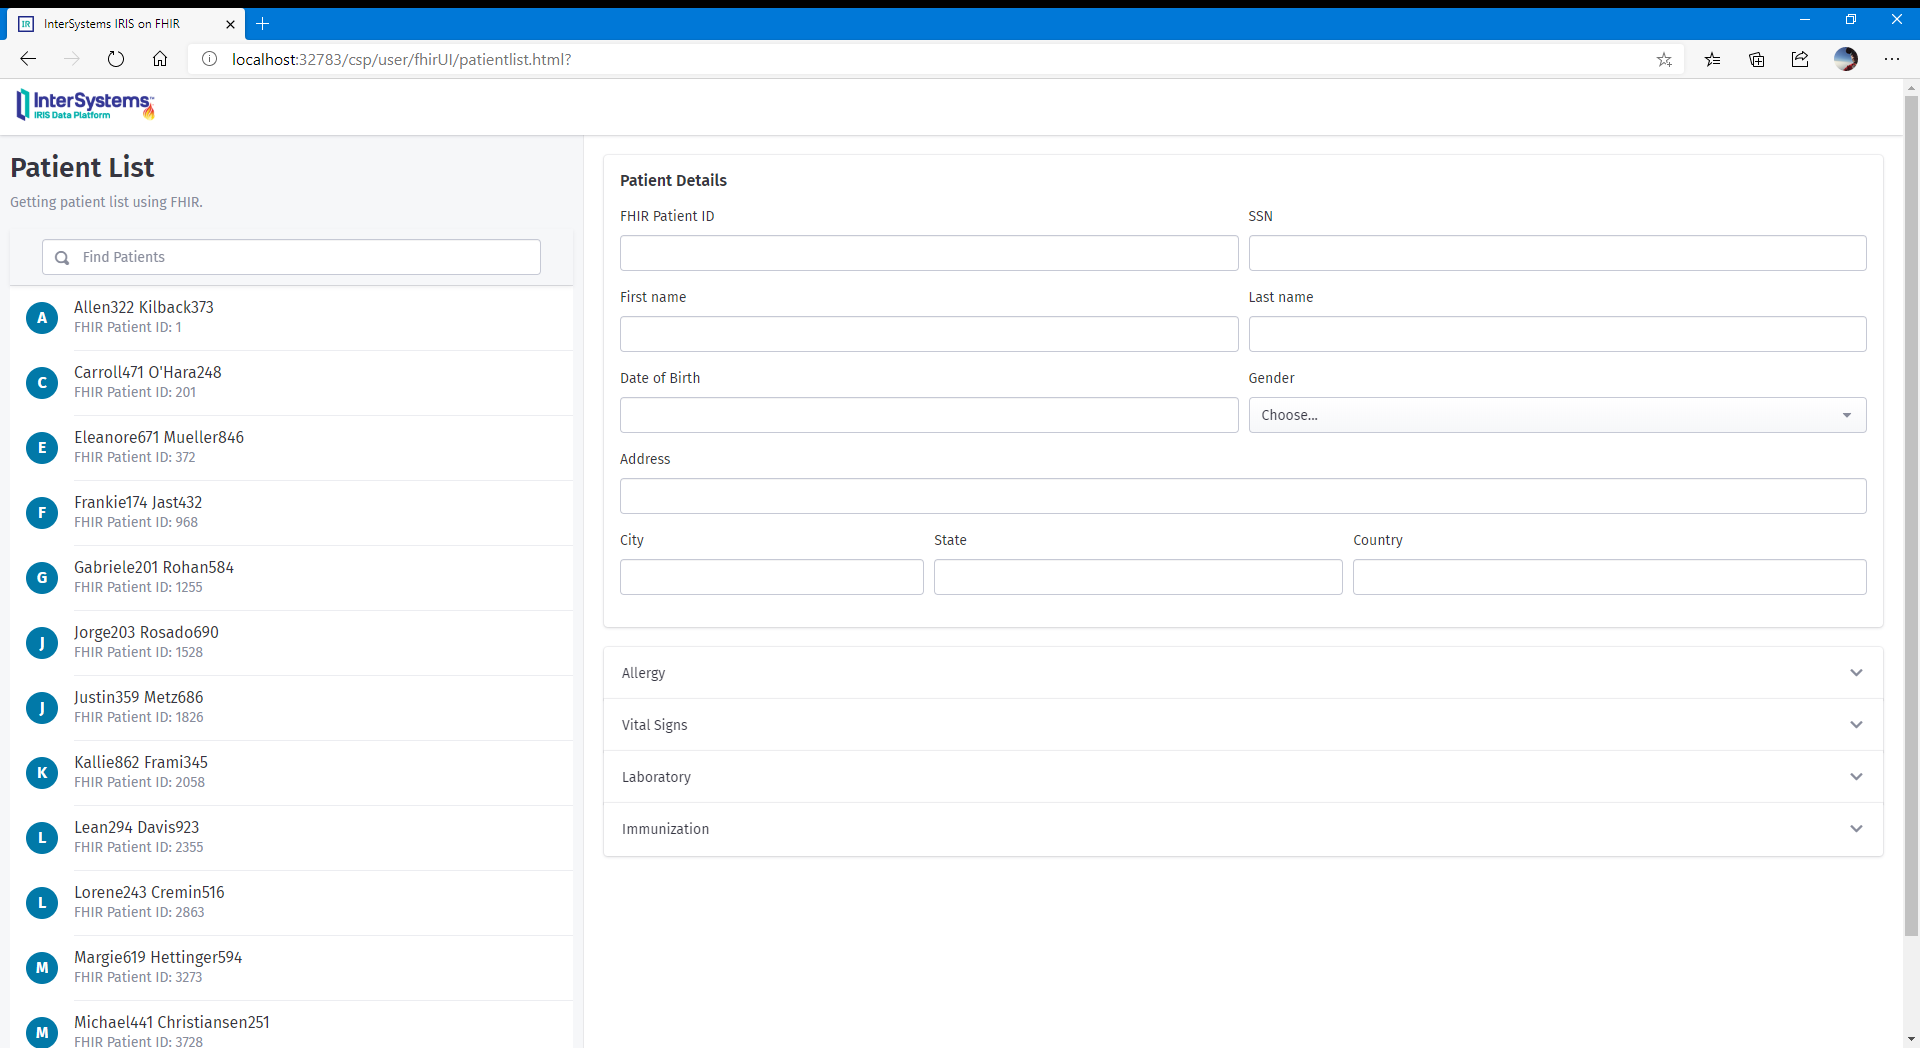
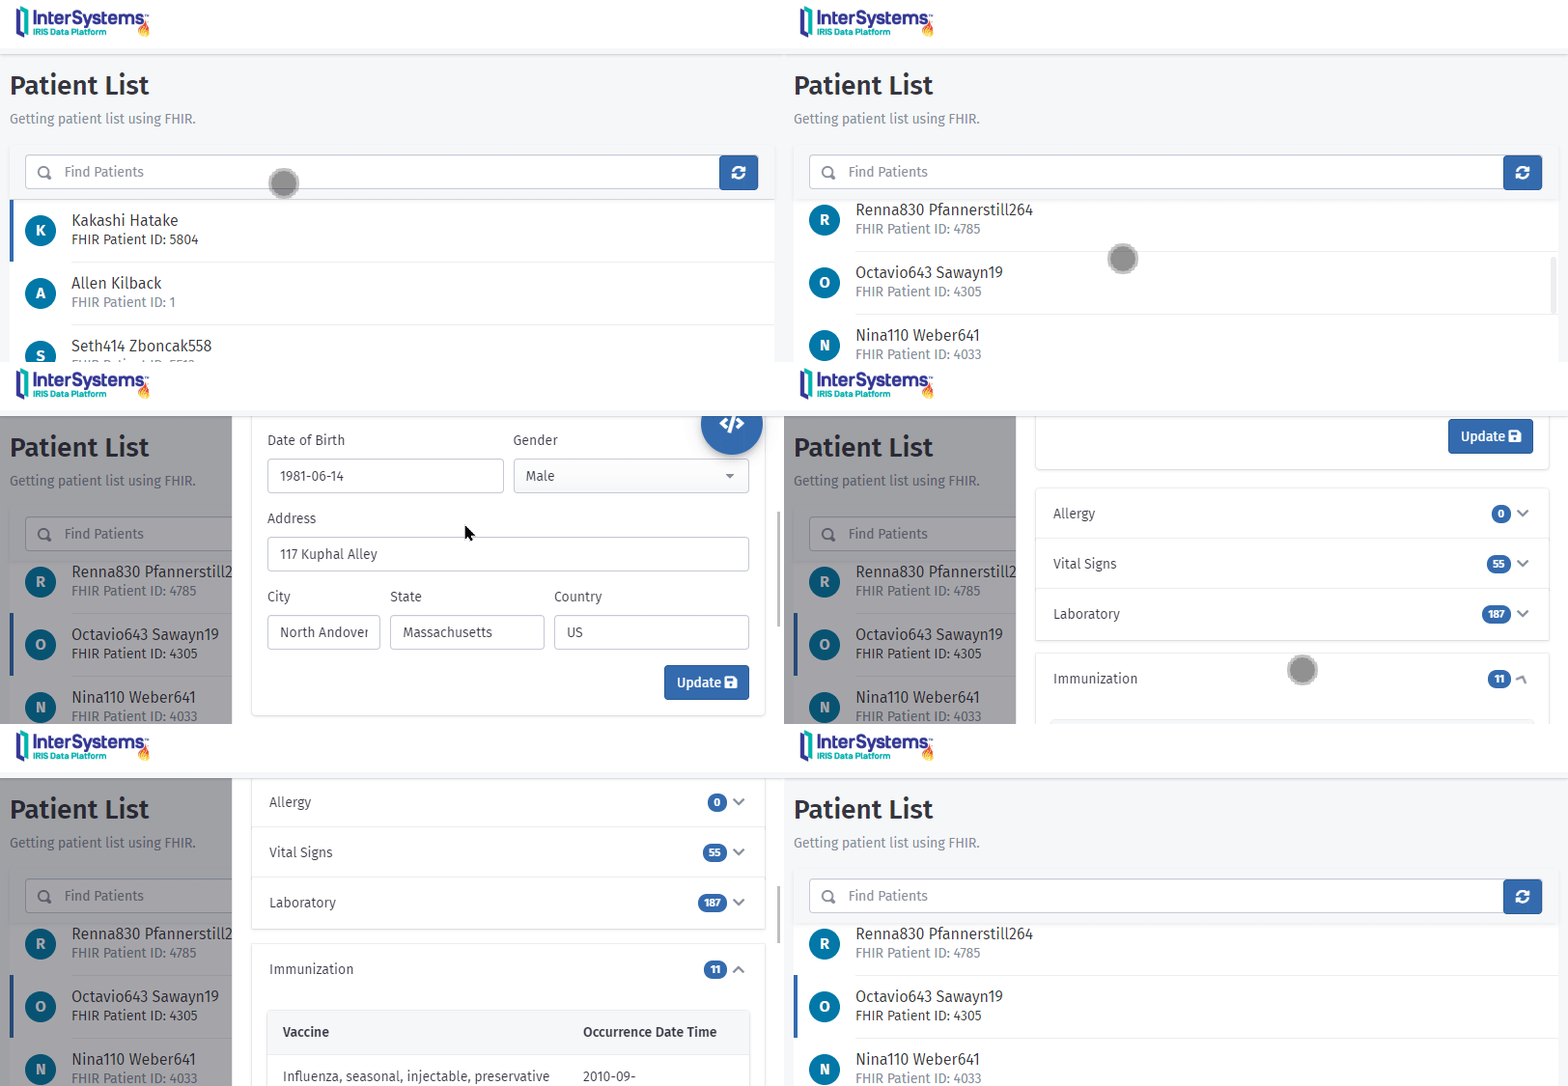
On the left panel, you have a patient list with a filter bar on top.

Clicking on the patient will give you detailed information on the Patient Details form.
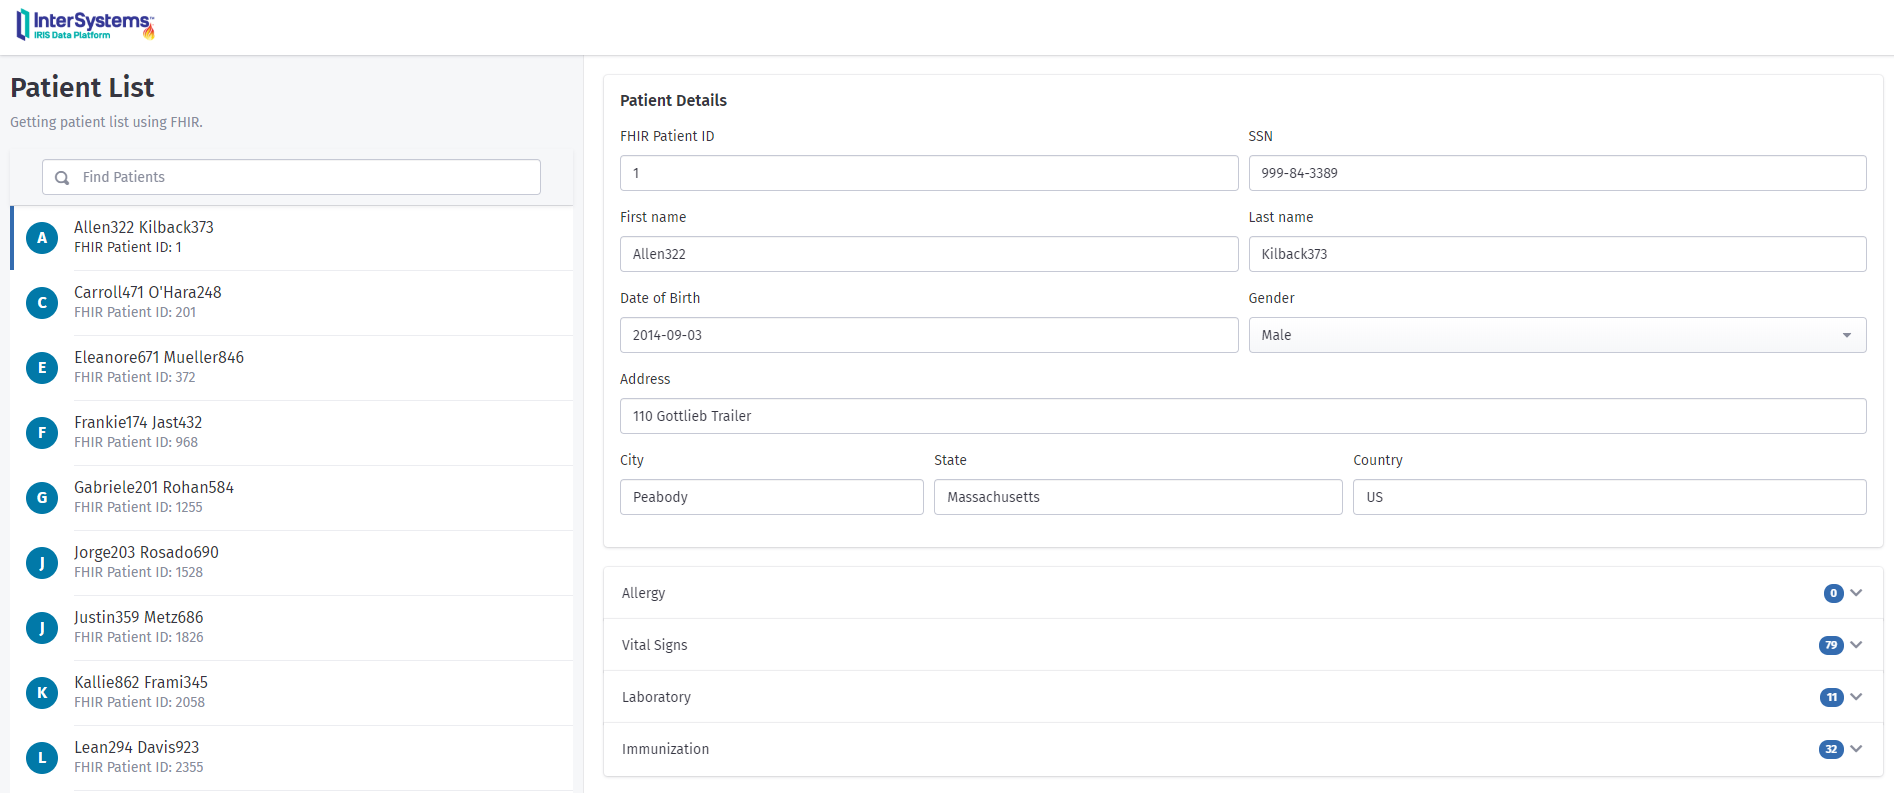
The form provides the following information:
- FHIR Patient ID
- SSN (Social Security Number)
- First Name
- Last Name
- Date of Birth
- Gender
- Address
- City
- State
- Country
After the Patient Details form, we have an accordion with four blocks of information. The FHIR Resources that provide those pieces of information are:
- AllergyIntolerance
- Observation
-
- Category: vital-signs
-
- Category: laboratory
- Immunization
Here we have a screenshot of Laboratory Results:

It’s possible to update the Patient Details
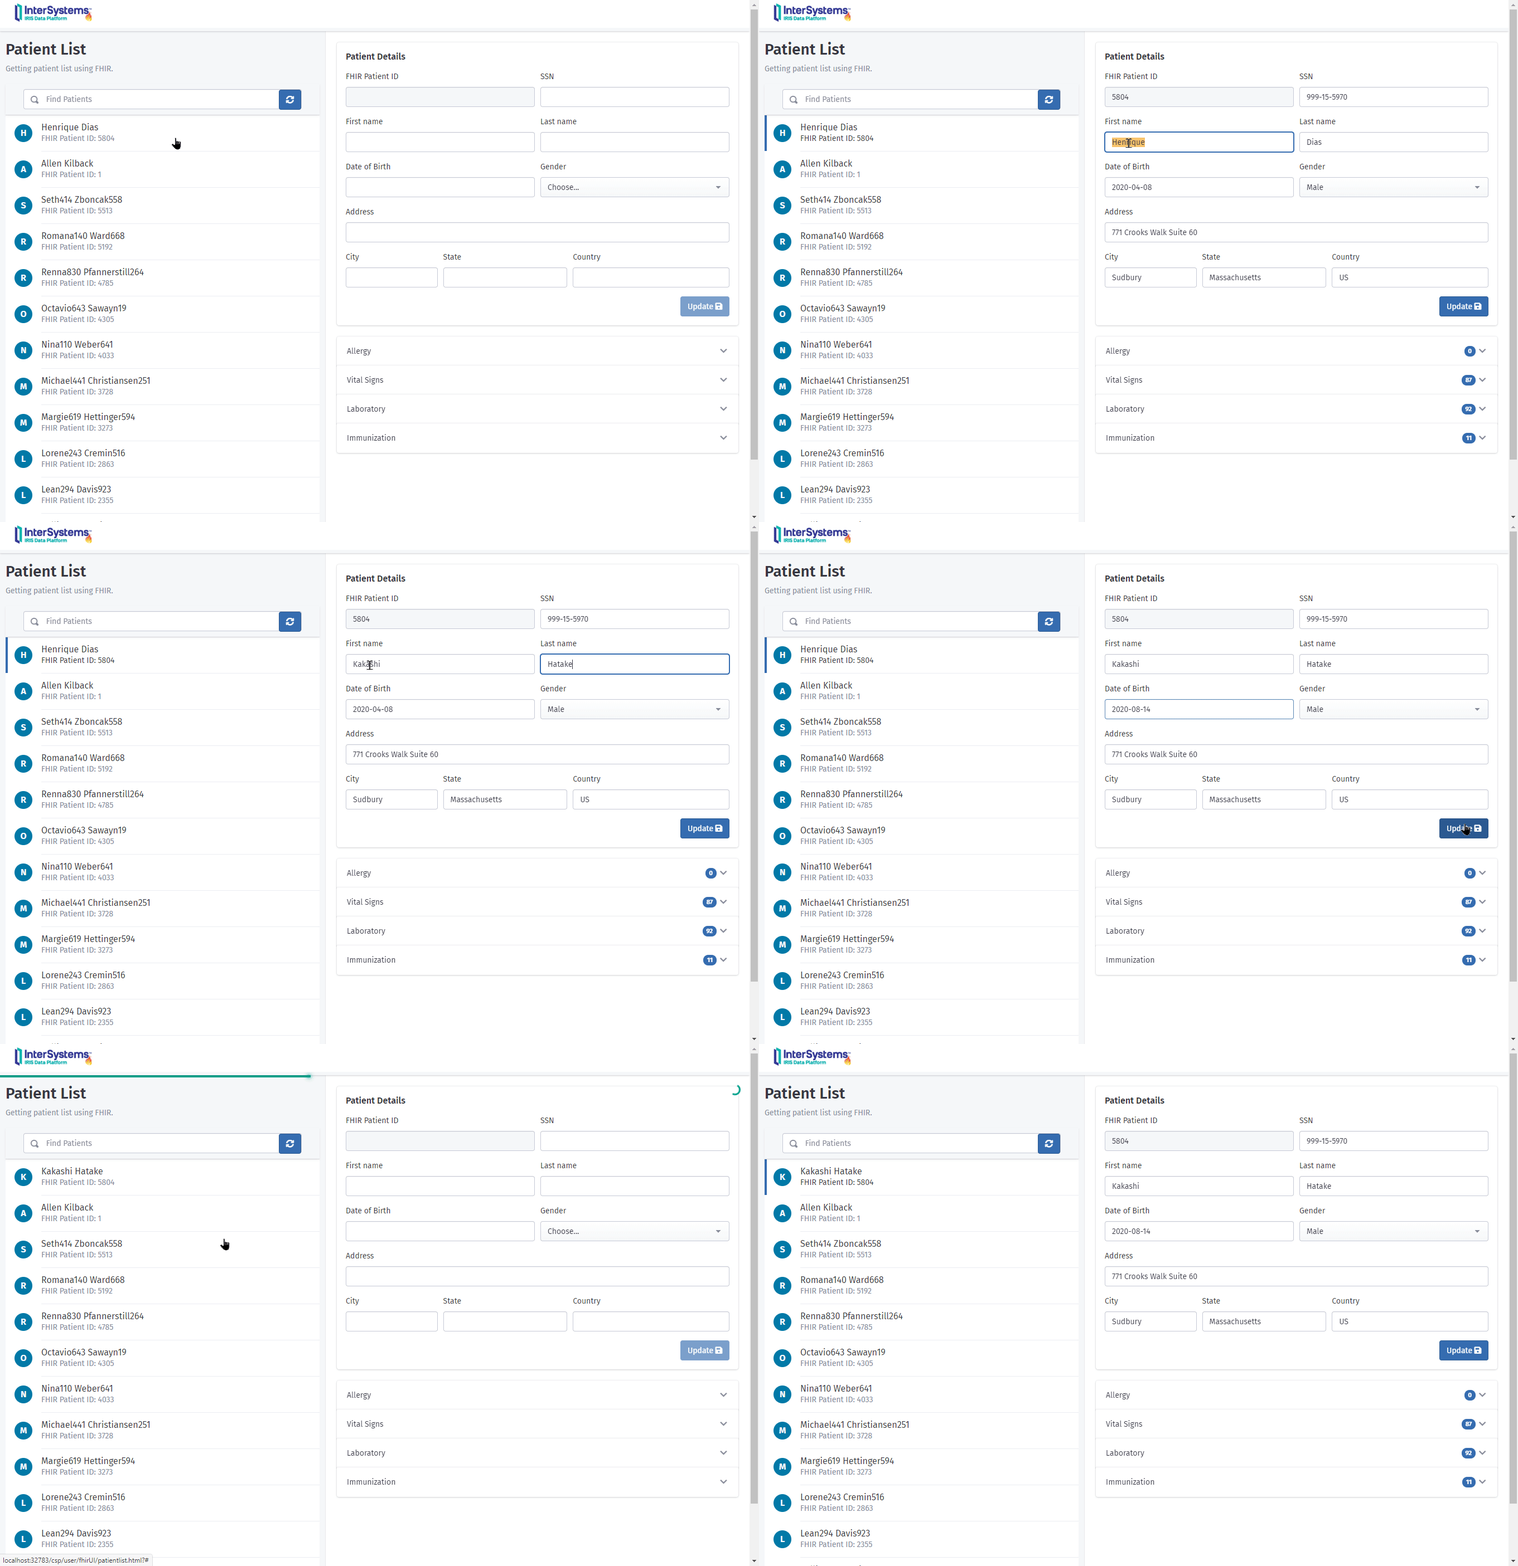
Interface
The interface it’s totally responsive. Meaning that you can browse the results on mobile devices.
Portrait Mode
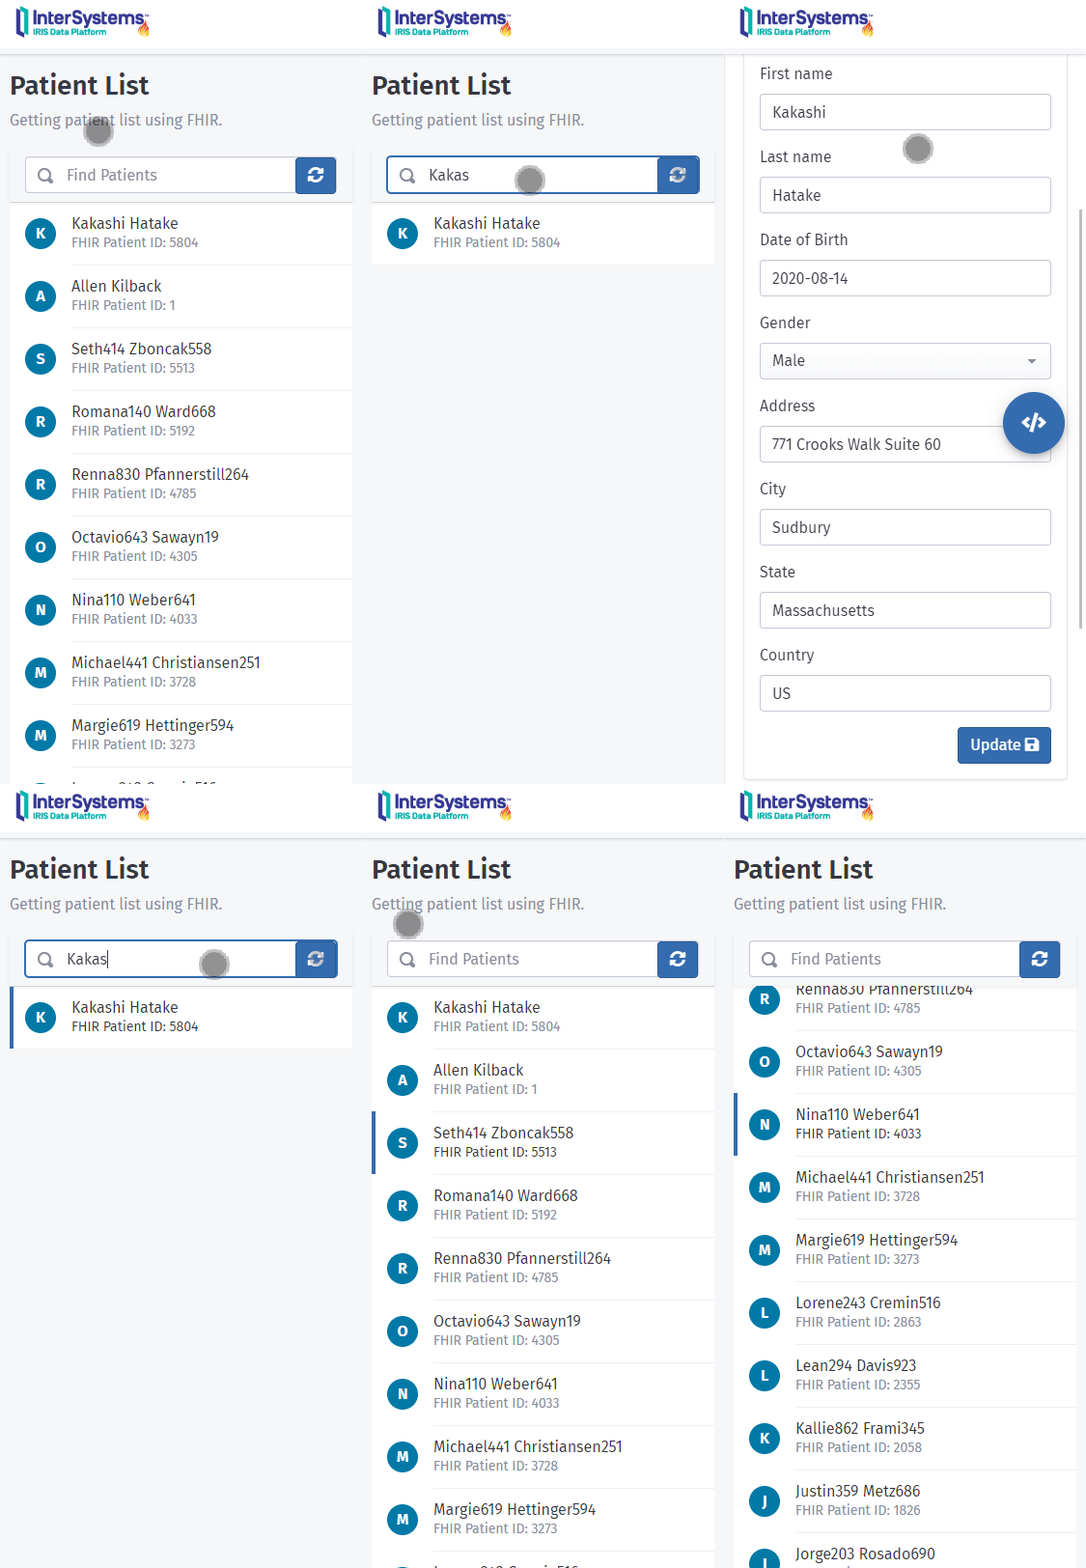
Landscape Mode
Charts for Laboratory Results
When you realize the same lab tests over time, the best way to compare the results is through charts! They give you a better perspective of your evolution over time.
Thinking about that, I introduce to you the chart module for laboratory results!
Now, when the FHIR Resource gives us lab results an icon/link will appear to let you see the results in a chart format.
![]()
The lab results will open in a new page.
The selection “Lab Tests” will show all the tests for the patient.
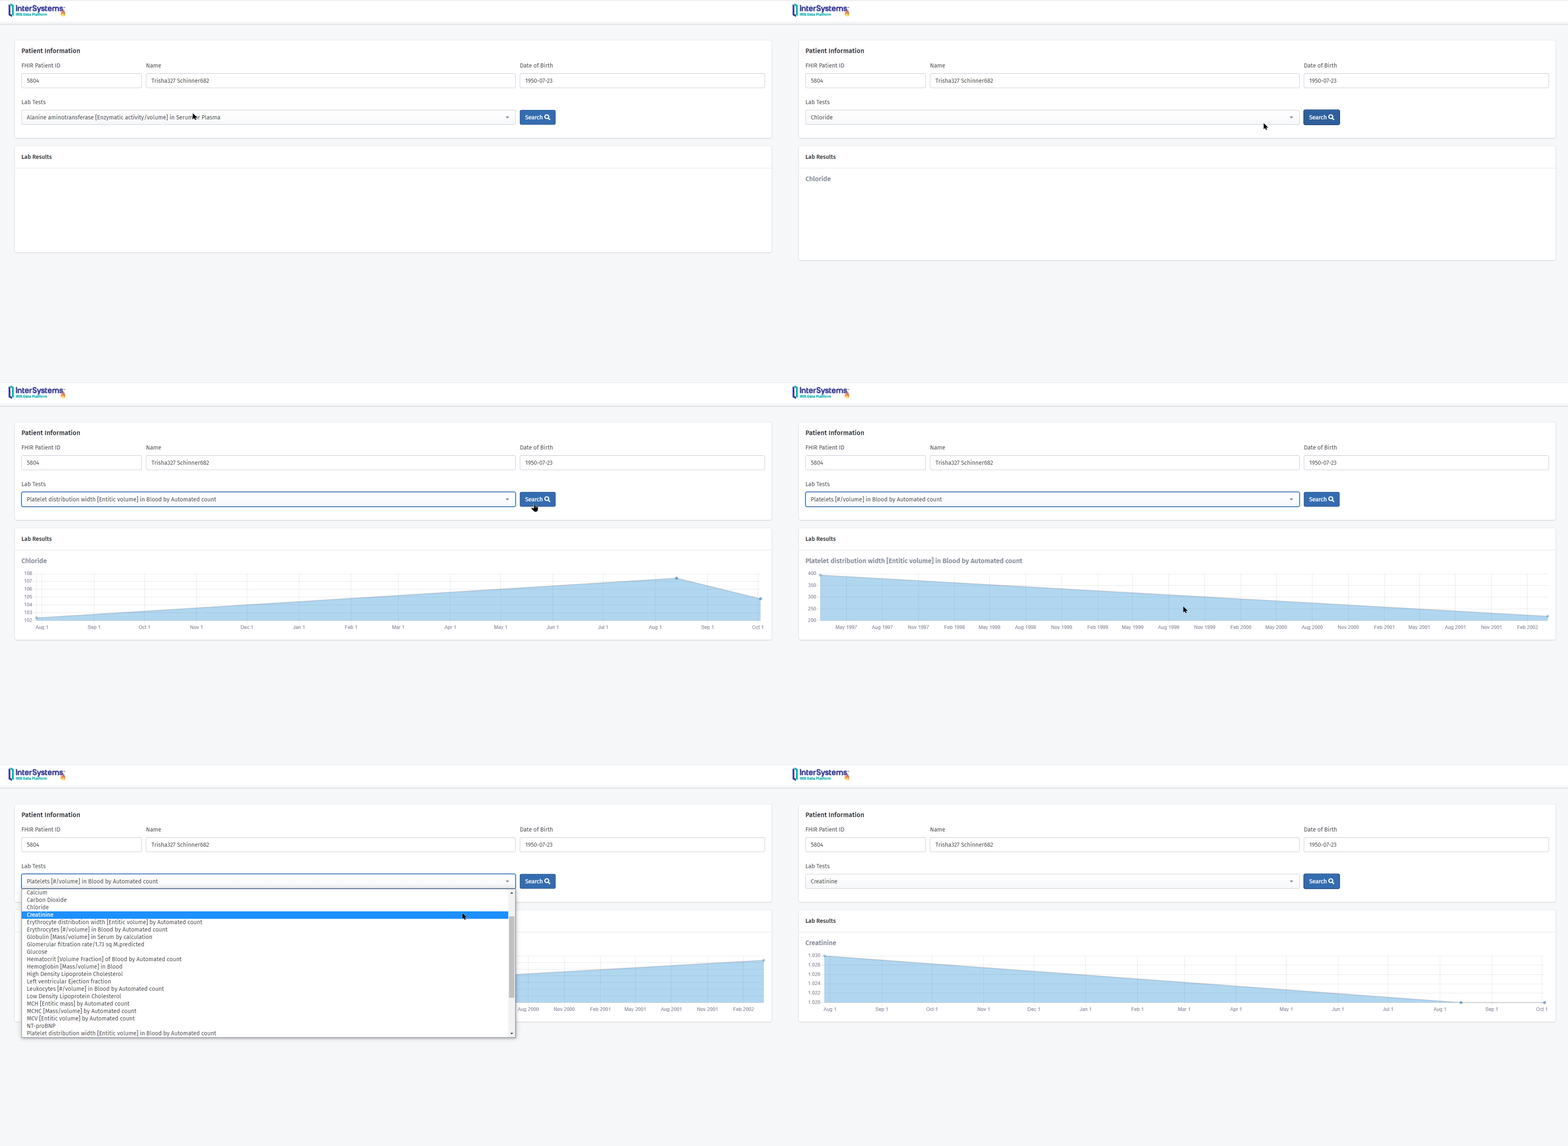
All information provided on this page was retrieved making usage of SQL Schema of FHIR Resources.
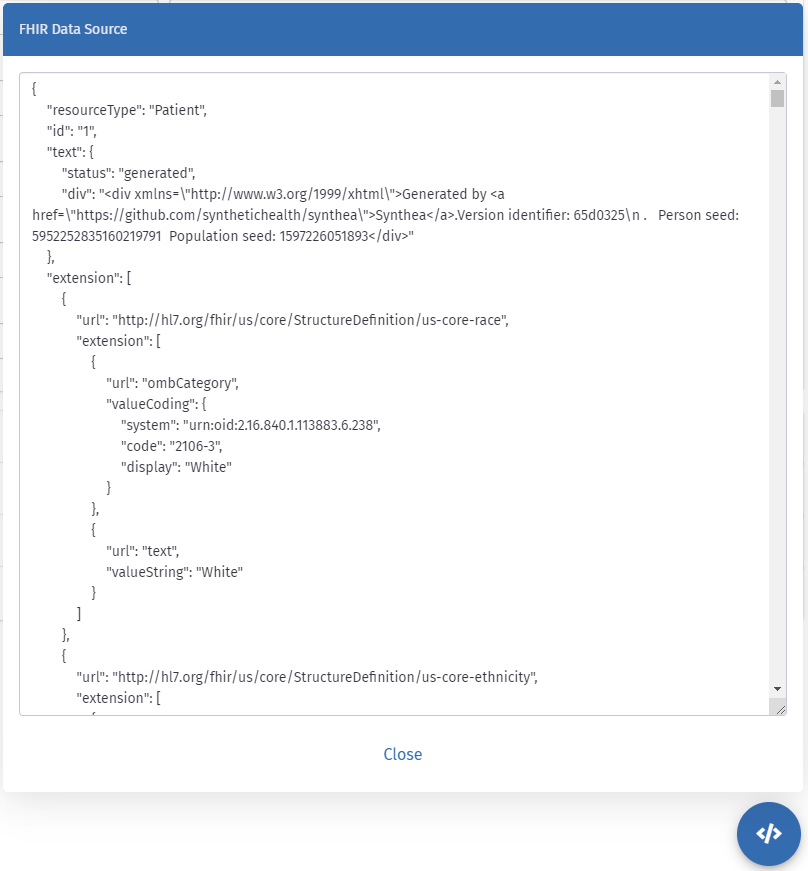
FHIR Data Source
For a transparent approach with patient data, at the end of the page, there is a modal with all the information provided by the FHIR resources.


 zpm install fhir-portal
  download archive
  PassedView report
