© 2026 InterSystems Corporation, Cambridge, MA. All rights reserved.Privacy & TermsGuaranteeSection 508Contest Terms
iris-python-dashboards 

5
1 reviews
0
Awards
605
Views
0
IPM installs
 0
0 1
1
Details
Releases (2)
Reviews (1)
Issues
Articles (2)
Data Visualization App Using Embedded Python
What's new in this version
- Added authorization based on IRIS data
- Update page "IRIS python usage"
IRIS-python-dashboards
This app shows data visualization. For example, Covid19 data was used. The Dash framework used to build Dashboards is a Python framework created by plotly for building interactive web applications. Dash is open source and building an application using this framework is viewed in a web browser.
Installation
Docker
The repo is dockerised so you can clone/git pull the repo into any local directory
$ git clone https://github.com/NjekTt/iris-python-dashboards.git
Open the terminal in this directory and run:
$ docker-compose up -d
App
After installation open http://localhost:8080/
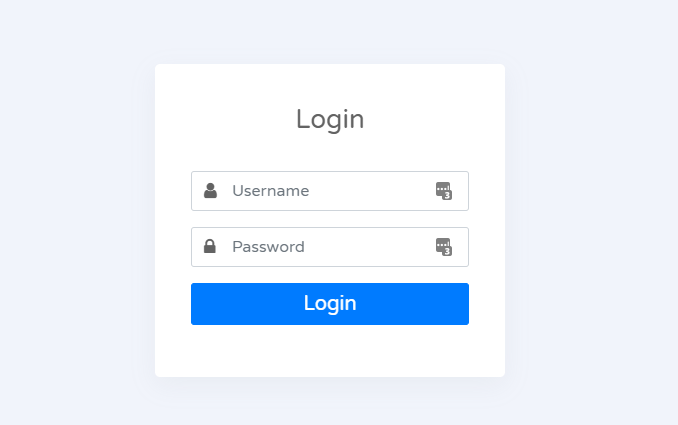
After you will be redirected to the authorization page. Authorization is based on the IRIS database. Default login and password is _SYSTEM : SYS
The main page will show the first dashboard, which visualizes Covid data taken from the local IRIS database
On the left is the navigation menu.
- Overview - shows the general dashboard
- Timeline - a map is shown, there is a player at the bottom of the map, timeline shows the dynamics of data on the world map
- IRIS python usage - guide how python embedded was used, how data was retrieved from the IRIS database and a small example of using the IRIS Native API for Python
Online demo link : http://atscale.teccod.ru:8080/
Screencast
Overview

Timeline

IRIS python usage

Last checked by moderator
27 Jan, 2026WorksMade with
Version
1.1.022 Feb, 2022
Category
Works with
InterSystems IRISFirst published
20 Feb, 2022Last edited
22 Feb, 2022