© 2026 InterSystems Corporation, Cambridge, MA. All rights reserved.Privacy & TermsGuaranteeSection 508Contest Terms

iris-mlm-explainer 

5
1 reviews
0
Awards
522
Views
0
IPM installs
 2
2 2
2
Details
Releases (2)
Reviews (1)
Issues
Articles (2)
Create, Train, Validate, Predict and Explore ML models
What's new in this version
Web Application added to do the prediction
iris-mlm-explainer
This web application connects to InterSystems Cloud SQL to create, train, validate, and predict ML models, make Predictions and display a dashboard of all the trained models with an explanation of the workings of a fitted machine learning model.
The dashboard provides interactive plots on model performance, feature importances, feature contributions to individual predictions, partial dependence plots, SHAP (interaction) values, visualization of individual decision trees, etc.
The Application includes the following:
- Web Application to view the Prediction

- Web Application for explainer dashboard which includes the following:
- SHAP values (i.e. what is the contribution of each feature to each individual prediction?)
- Permutation importance (how much does the model metric deteriorate when you shuffle a feature?)
- Partial dependence plots (how does the model prediction change when you vary a single feature?)
- For Random Forests and xgboost models: visualization of individual trees in the ensemble.
- Plus for classifiers: precision plots, confusion matrix, ROC AUC plot, PR AUC plot, etc
- For regression models: goodness-of-fit plots, residual plots, etc.

Prerequisits
- You should have an account with InterSystems Cloud Service Portal.
- You should have Git installed locally.
- You should have Python3 installed locally.
Getting Started
We will follow the below steps to create and view the explainer dashboard of a model :
- Step 1 : Close/git Pull the repo
- Step 2 : Login to InterSystems Cloud SQL Service Portal
- Step 2.1 : Add and Manage Files
- Step 2.2 : Import DDL and data files
- Step 2.3 : Create Model
- Step 2.4 : Train Model
- Step 2.5 : Validate Model
- Step 3 : Activate python virtual environment
- Step 4 : Run Web Application for prediction
- Step 5 : Explore the Explainer dashboard
Step 1 : Close/git Pull the repo
So Let us start with first Step
Create folder and Clone/git pull the repo into any local directory
git clone https://github.com/mwaseem75/iris-mlm-explainer.git
Step 2 : Log in to InterSystems Cloud SQL Service Portal
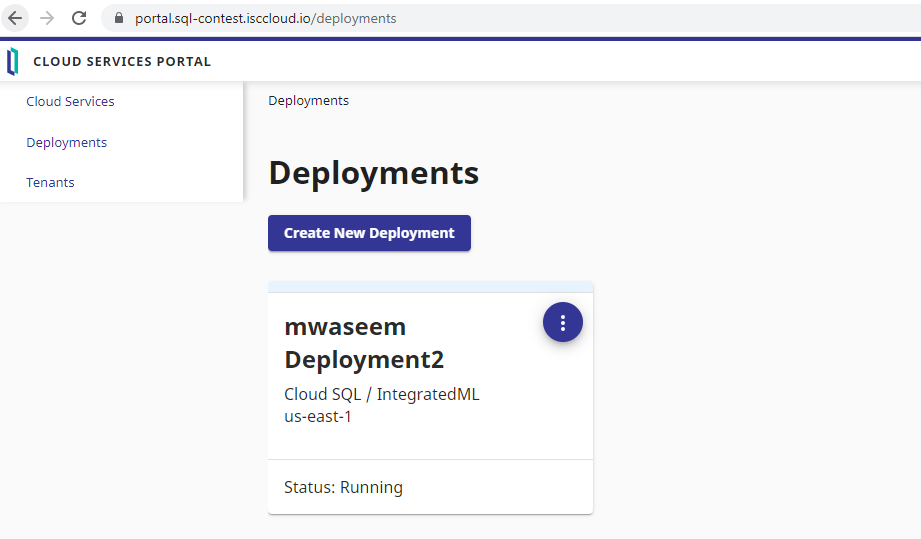
Log in to InterSystems Cloud Service Portal
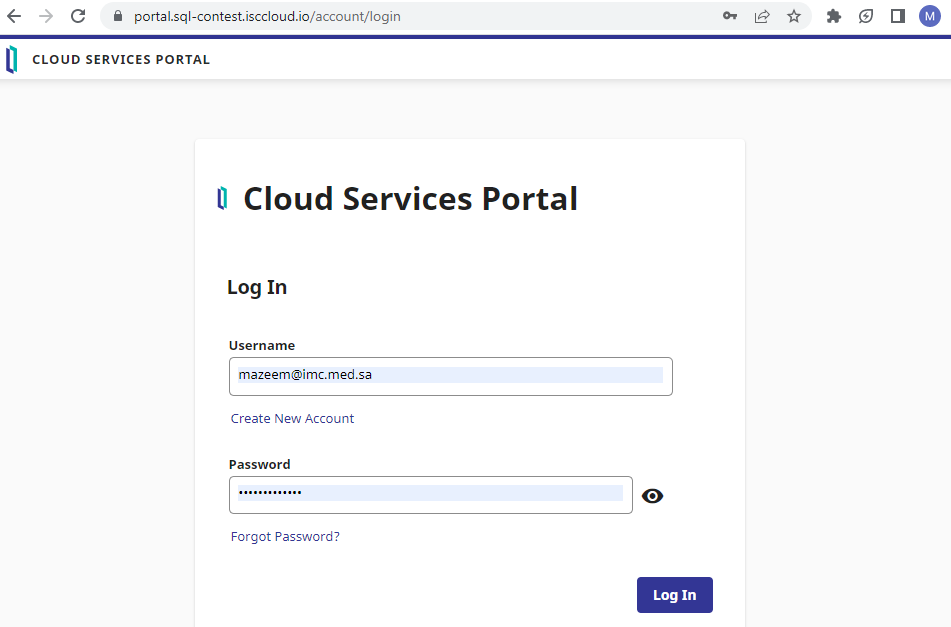
Select the running deployment
Step 2.1 : Add and Manage Files
Click on Add and Manage Files
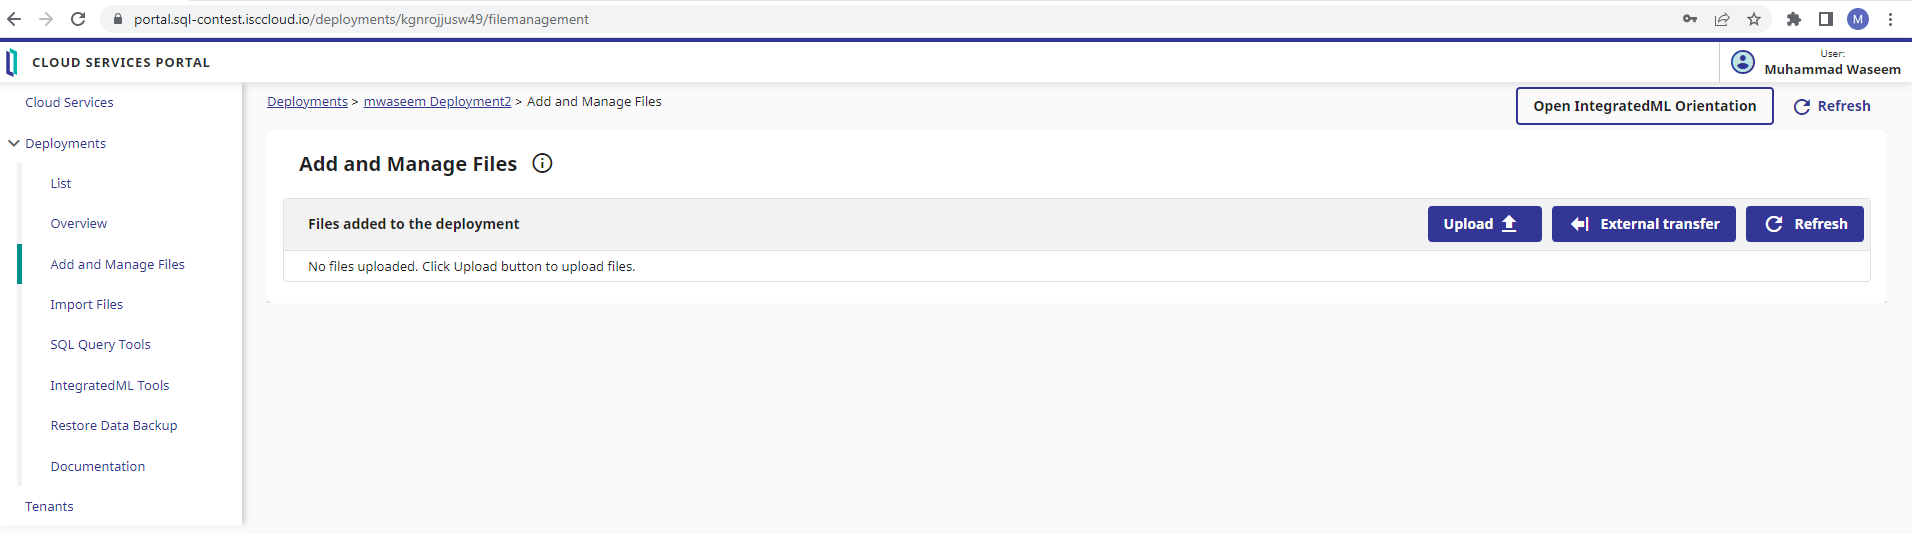
Repo contains USA_Housing_tables_DDL.sql(DDL to create tables), USA_Housing_train.csv(training data), and USA_Housing_validate.csv(For validation) files under the datasets folder. Select the upload button to add these files.

Setp 2.2 : Import DDL and data files
Click on Import files, then click on DDL or DML statement(s) radio button, then click the next button

Click on Intersystems IRIS radio button and then click on the next button

Select USA_Housing_tables_DDL.sql file and then press the import files button

Click on Import from the confirmation dialog to create the table

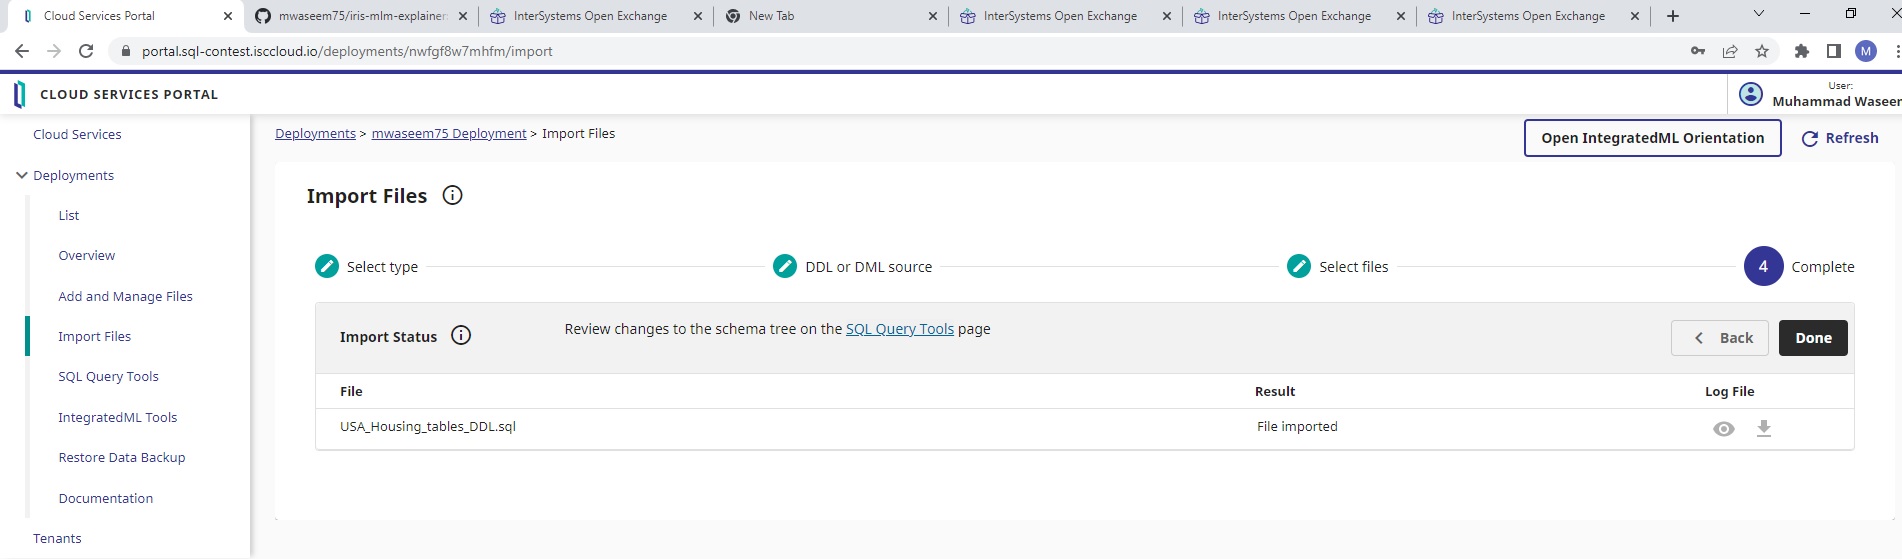
Click on SQL Query tools to verify that tables are created

Import data files
Click on Import files, then click on CSV data radio button, then click the next button

Select USA_Housing_train.csv file and click the next button
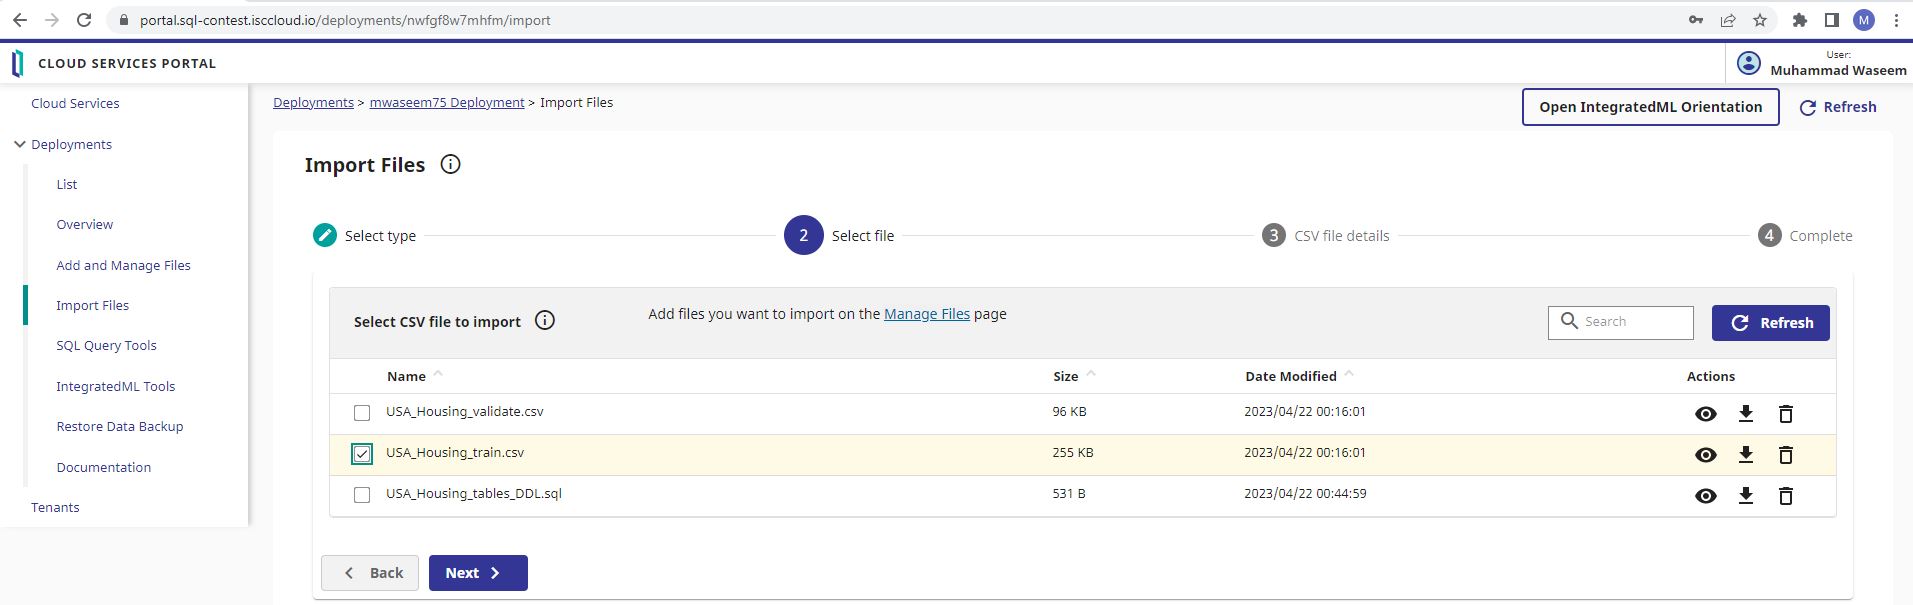
Select USA_Housing_train.csv file from the dropdown list, check import rows as a header row and Field names in header row match column names in selected table and click import files

click on import in the confirmation dialog
 click on import in the confirmation dialog
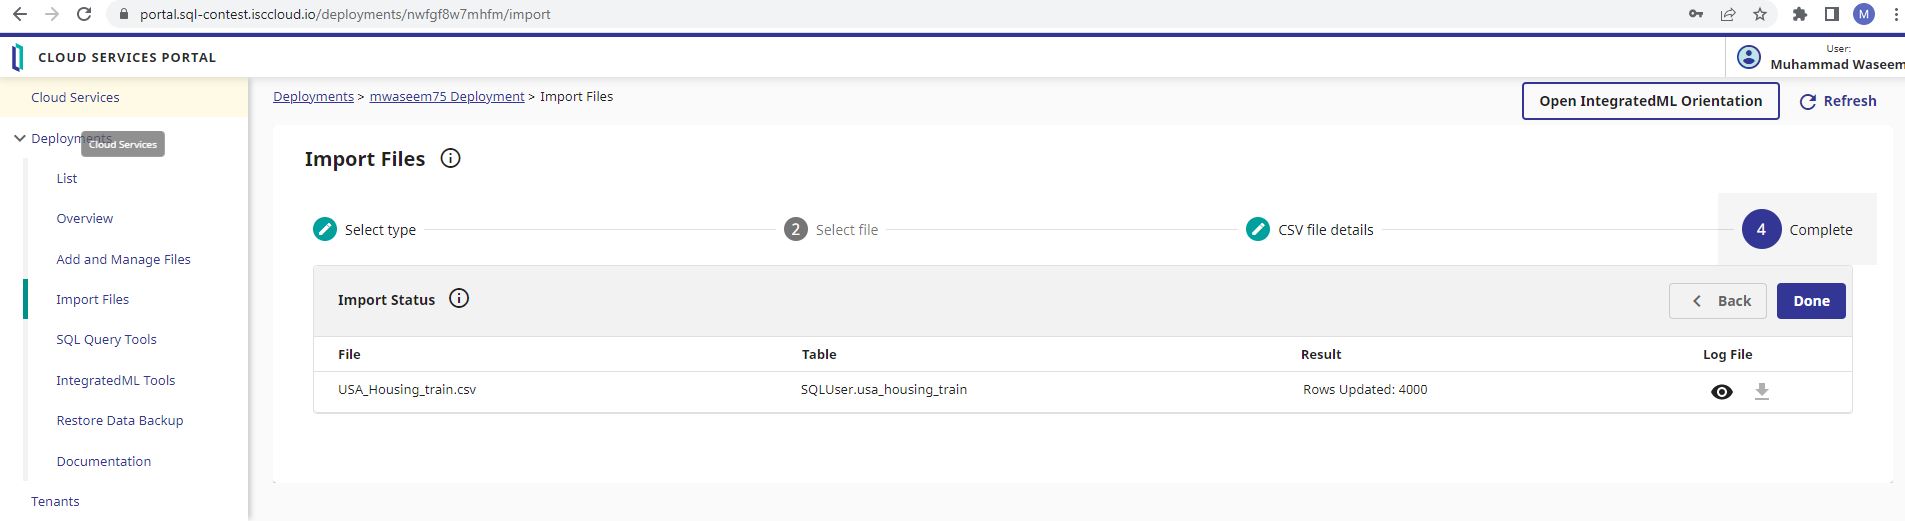
Make sure 4000 rows are updated
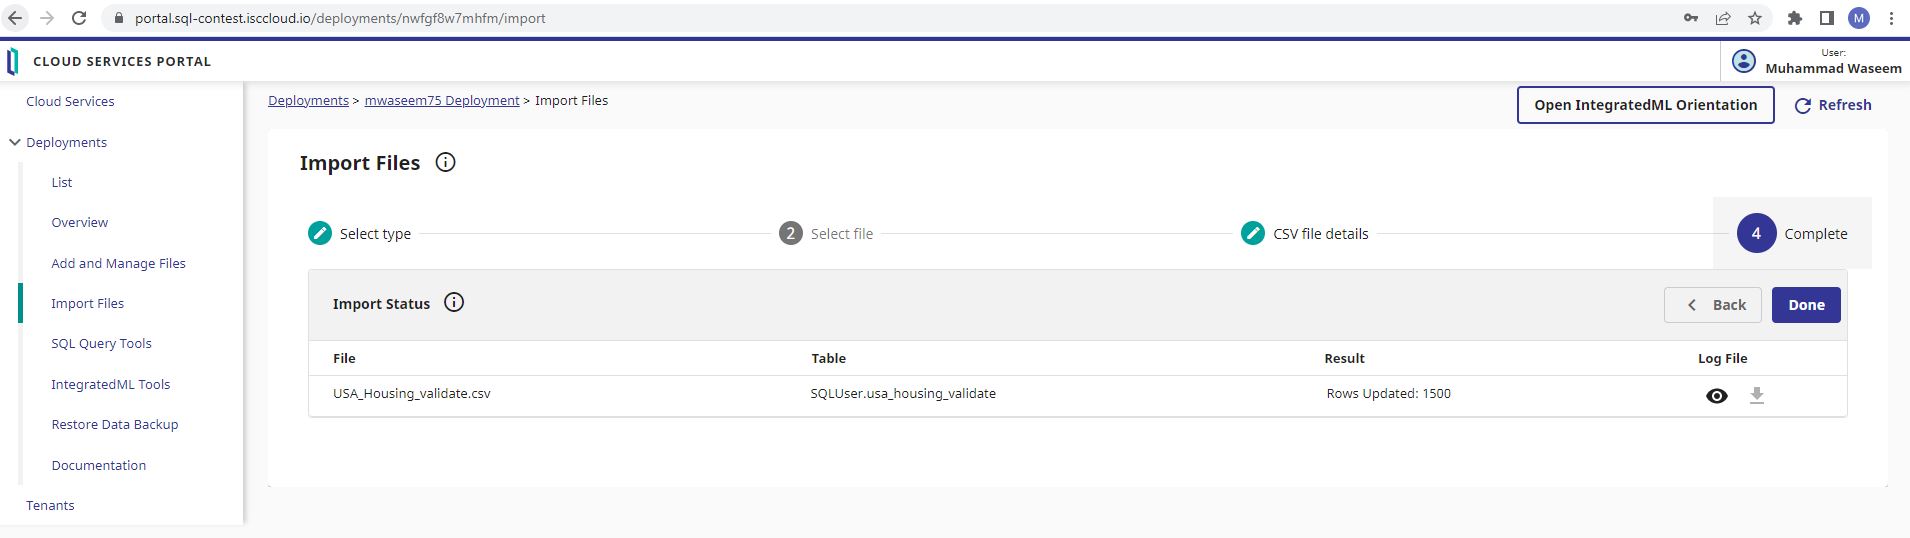
Do the same steps to import USA_Housing_validate.csv file which contains 1500 records
Setp 2.3 : Create Model
Click on IntegratedM tools and select Create Panel.
Enter USAHousingPriceModel in the Model Name field, Select usa_housing_train table and Price in the field to predict dropdown. Click on create model button to create the model

Setp 2.4 : Train Model
select Train Panel, Select USAHousingPriceModel from the model to train dropdownlist and enter USAHousingPriceModel_t1 in the train model name field

Model will be trained once Run Status completed

Setp 2.5 : Validate Model
Select Validate Panel, Select USAHousingPriceModel_t1 from Trained model to validate dropdownlist, select usa_houseing_validate from Table to validate model from dropdownlist and click on validate model button

Click on show validation metrics to view metrics

Click on the chart icon to view the Prediction VS Actual graph

Step 3 : Activate python virtual environment
Repository already contains python virtual environment folder (venv) along with all the required libraries.
All we need is to just activate the environment
On Unix or MacOS:
$ source venv/Scripts/activate
On Windows:
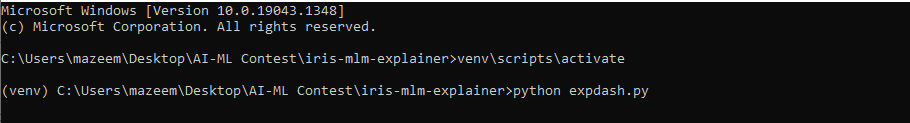
venv\scripts\activate
Step 4 : Run Web Application for prediction
Run the below command in virtual environment to start our main application
python app.py

Navigate to http://127.0.0.1:5000/ to run the application
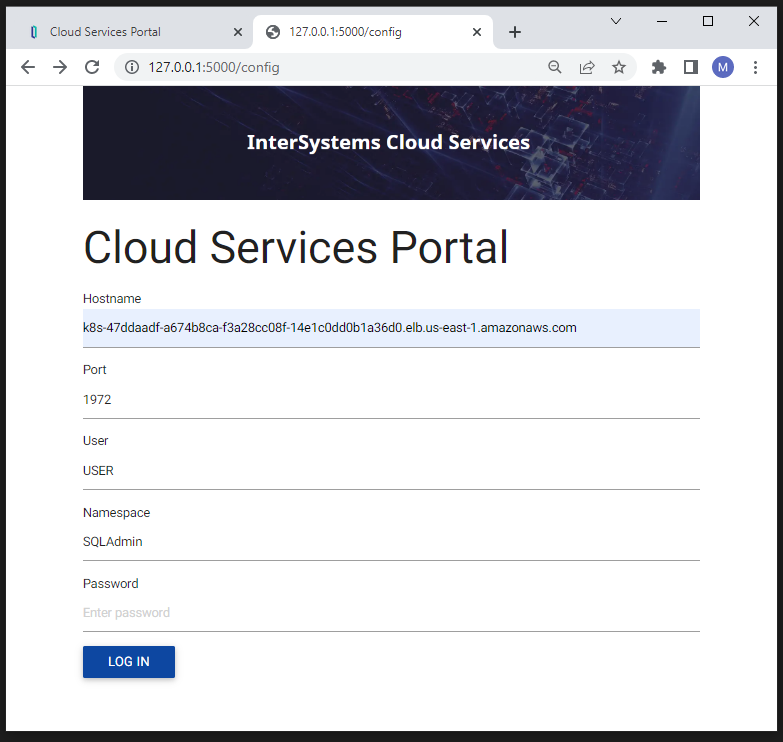
Put same values used in InterSystems Cloud SQL

Enter Age of house, No of rooms, No of bedroom and Area population to get the prediction
Step 5 : Explore the Explainer dashboard
Finaly, run the below command in virtual environment to start our main application
python expdash.py
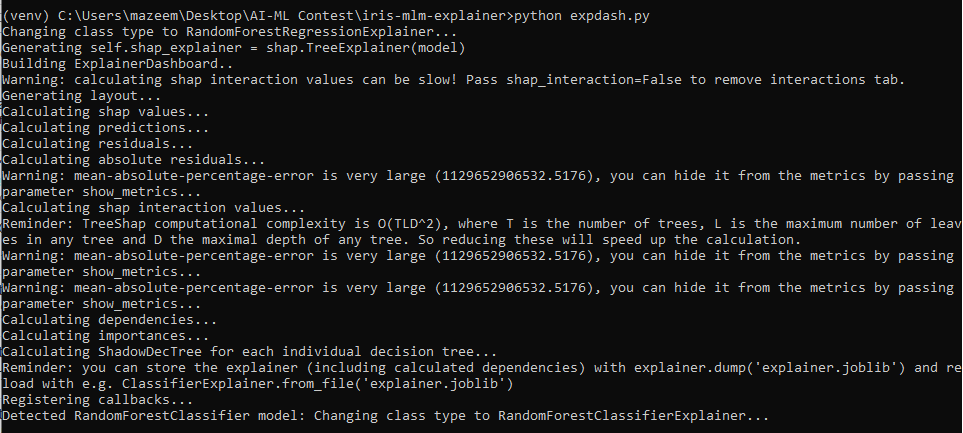

Navigate to http://localhost:8050/ to run the application

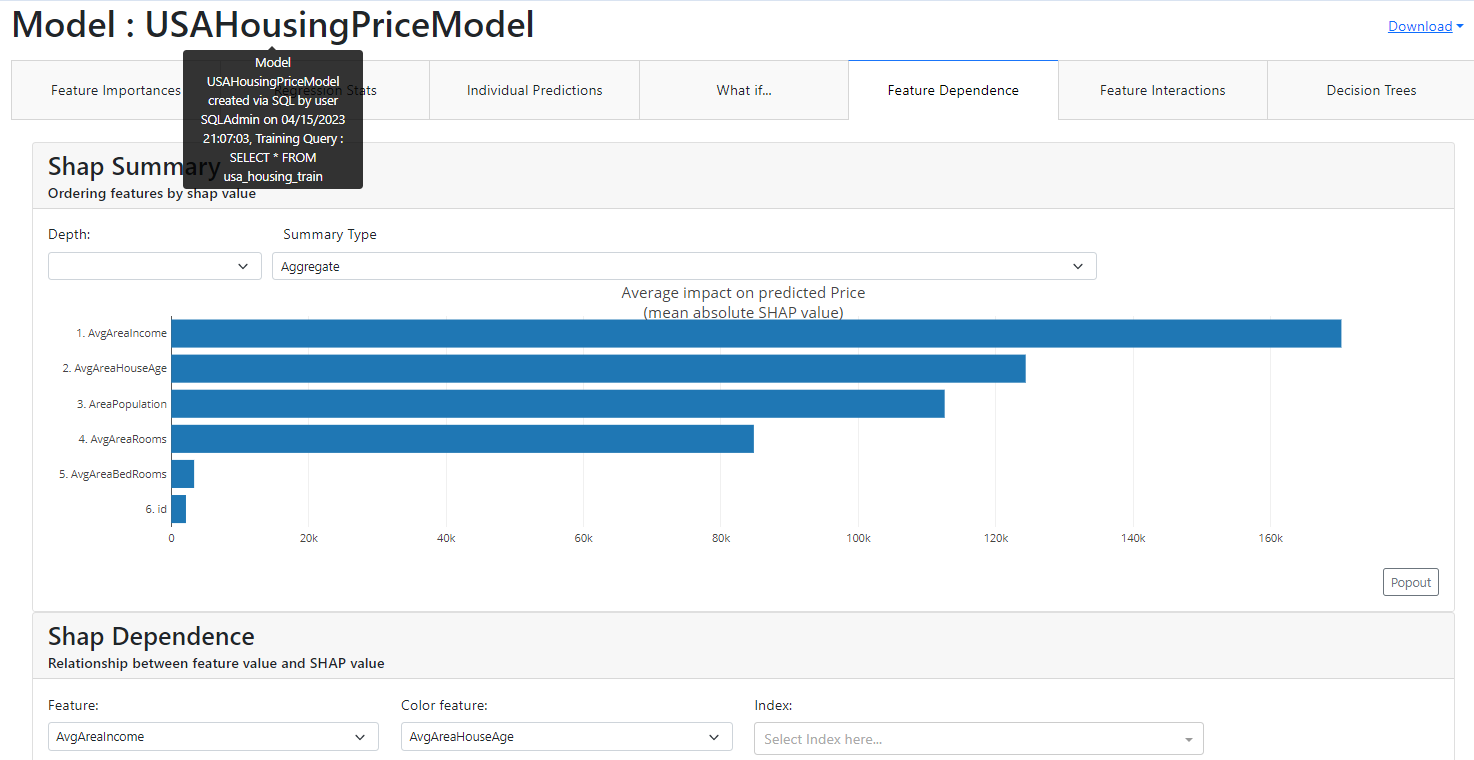
Application will list all the trained models along with our USAHousingPriceModel. Navigate to “go to dashboard” hyperlink to view model explainer
Feature Importances. Which features had the biggest impact?

Quantitative metrics for model performance, How close is the predicted value to the observed?

Prediction and How has each feature contributed to the prediction?

Adjust the feature values to change the prediction

Shap Summary, Ordering features by shap value
Interactions Summary,Ordering features by shap interaction value

Decision Trees, Displaying individual decision trees inside Random Forest

Using Jupyter notebook to create,train,validate and predict ML model (OPTIONAL)
We can also use jupyter notebook to create,train,validate and predict ML model if not created by using Cloud SQL Service Portal
Repo also contains USAHousingModelNotebook.ipynb Jupyter notebook. In order to run it, just run runnotebook.bat under venv environment
runnotebook
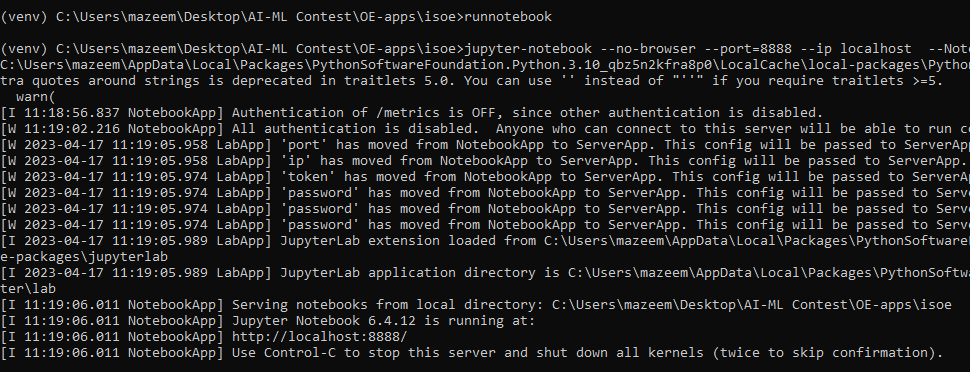
Navigate to http://localhost:8888/ to run the notebook
open USAHousingModelNotebook.ipynb notebook by clicking on it

It will open the notebook

NOTE : Make sure to select venv kernal by selecting main menu Kernal>Change kernal>venv, so that notebook will use virtual environment libraries

NOTE : Run the cells in sequence by just clicking the small arrow
About Dataset
USA Housing dataset is taken from Kaggle
LICENCE:Public Domain
USA_Housing dataset contains the following columns:
- ‘Avg. Area Income’: Avg. The income of residents of the city house is located in.
- ‘Avg. Area House Age’: Avg Age of Houses in the same city
- ‘Avg. Area Number of Rooms’: Avg Number of Rooms for Houses in the same city
- ‘Avg. Area Number of Bedrooms’: Avg Number of Bedrooms for Houses in the same city
- ‘Area Population’: The population of city house is located in
- ‘Price’: Price that the house sold at
NOTE: Column Name are modified and Id column is added in the dataset
Credits
This application is derived from the isc-cloud-sql-python-demo template by @Evgeny Shvarov
Thanks
Last checked by moderator
20 Jan, 2026WorksMade with
Version
1.0.220 Apr, 2023
Category
Works with
InterSystems IRIS Cloud SQLFirst published
16 Apr, 2023Last edited
22 Apr, 2023