© 2026 InterSystems Corporation, Cambridge, MA. All rights reserved.Privacy & TermsGuaranteeSection 508Contest Terms

iris-climate-change  Works
Works
Works

5
1 reviews
2
Awards
637
Views
0
IPM installs
 2
2 1
1
Details
Releases (1)
Reviews (1)
Awards (2)
Issues
Articles (2)
IRIS Climate Change, Data Sciences, Plotting and Visualization
What's new in this version
Initial Release
Summary
Climate change is one of the important issues that face the world in this technological era. According to NASA, Water Vapour, Carbon dioxide(CO₂), Methane, Nitrous oxide, Chlorofluorocarbons(CFCs) contribute to the greenhouse effect. Over the last century, human activities have increased concentrations of this natural greenhouse. The best proof of this situation is the historical temperature change. These human-produced temperature increases are commonly referred to as global warming.
IRIS Climate Change application investigates the reality of the increase in temperatures linked to industrial activities and the greenhouse effect.
Features
- Import The Food and Agriculture Organization (FAO) Climate Change dataset by using LOAD DATA (SQL) functionality
- Web application with the help of Python Flask Web Framework
- Pandas Python data analysis Library, Plotly Open Source Graphing Library for Python
- Plotly JavaScript Open Source Graphing Library
- Map Animation to show global surface climate change from 1961 to 2021.
- Bar Graph to show ten most countries that suffer from temperature change mostly in the last ten years
- Bar Graph to show ten countries that suffer from temperature change at the very least in the last ten years
- Line Chart to show any remarkable trend between the years according to World, annex I countries and non-annex I countries
- Line Chart to show any significant difference between seasons from 1961-2021
- Radar chart to show trend of temperature change in the world from 1961-2021
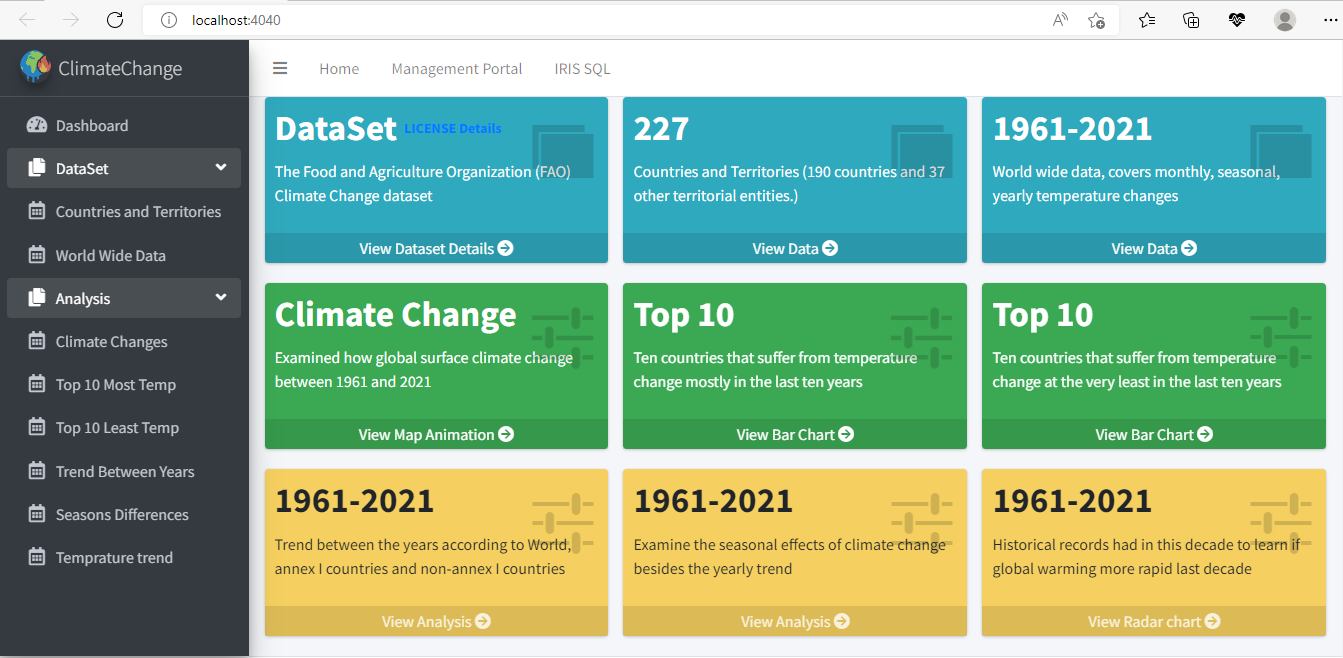
Application layout

Dataset
The Food and Agriculture Organization (FAO) Climate Change dataset : The FAOSTAT Temperature Change domain disseminates statistics of mean surface temperature change by country, with annual updates and the other dataset have country codes.
LICENCE Details
Installation
- Clone/git pull the repo into any local directory
git clone https://github.com/mwaseem75/iris-climate-change.git
- Open a Docker terminal in this directory and run:
docker-compose build
- Run the IRIS container:
docker-compose up -d
Getting Started
Run the application
To run the application Navigate to http://localhost:4040
Dashboard
View dataset from Management Portal
Upon container initialization dataset is imported to IRIS. To view table navigate to Management portal SQL by using USER namespace

View dataset from web application
From sidebar menu click DataSet and navigate to any child item OR click view data from dashboard related Tab


Data Analysis and Visualization
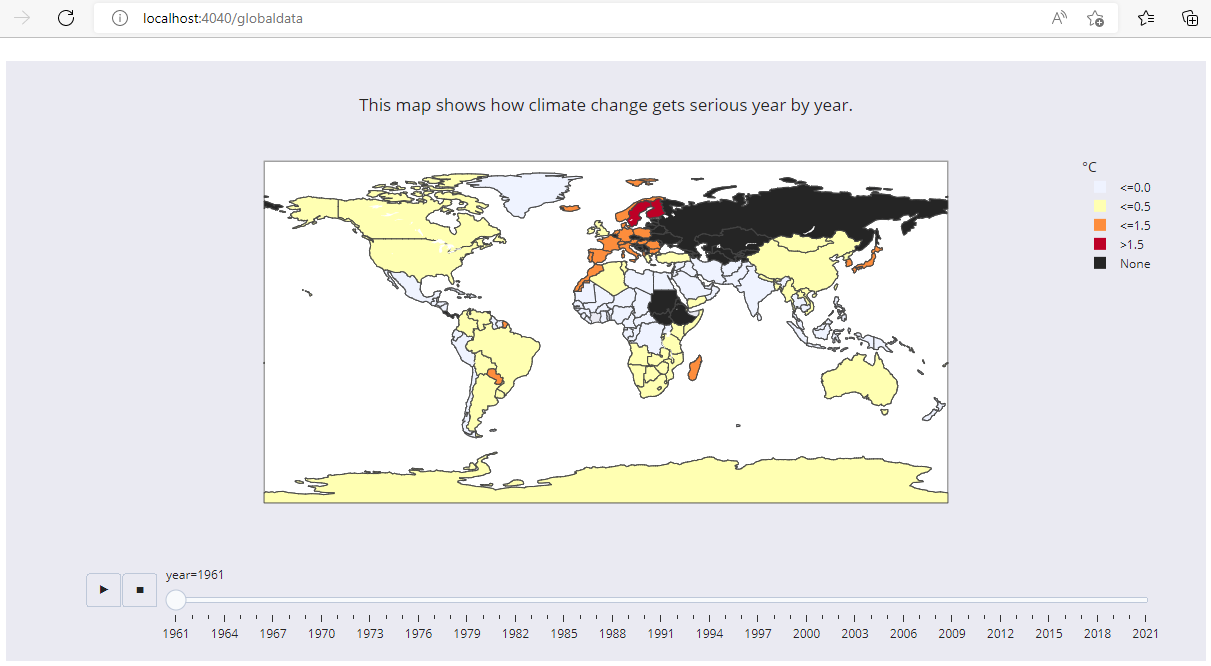
Map Animation
Examined how global surface climate change between 1961 and 2021
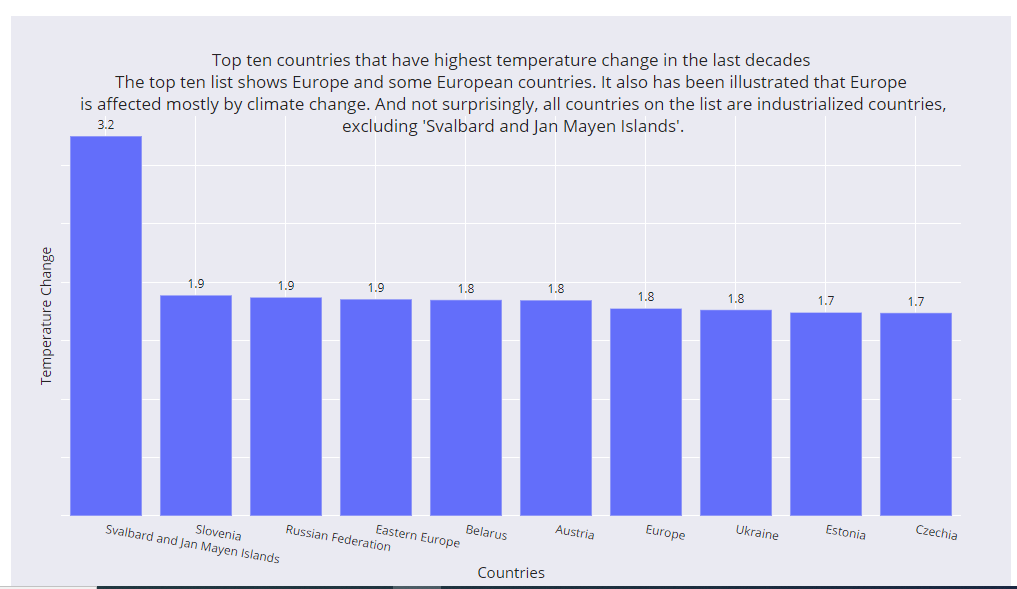
Top 10 Most (Bar Chart)
Ten countries that suffer from temperature change mostly in the last ten years
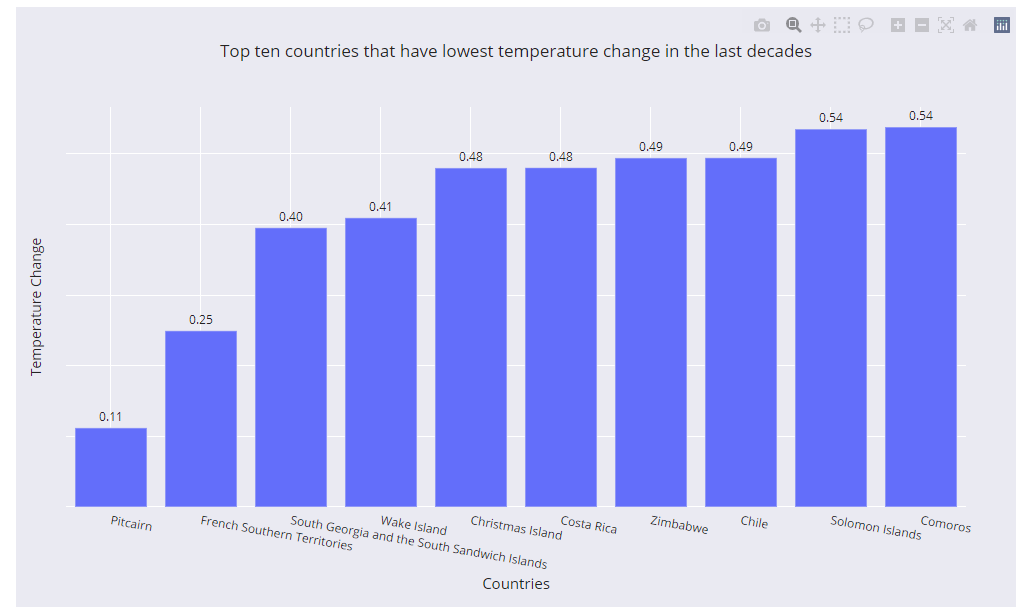
Top 10 Least countries (Bar Chart)
Ten countries that suffer from temperature change at the very least in the last ten years
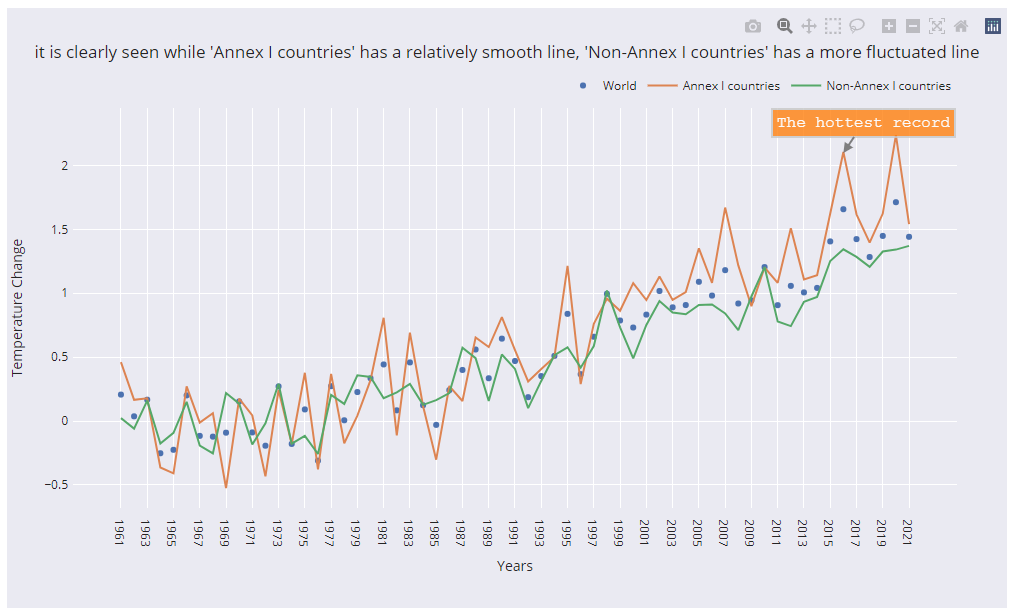
Trend between years (Line Chart)
Trend between the years according to World, annex I countries and non-annex I countries
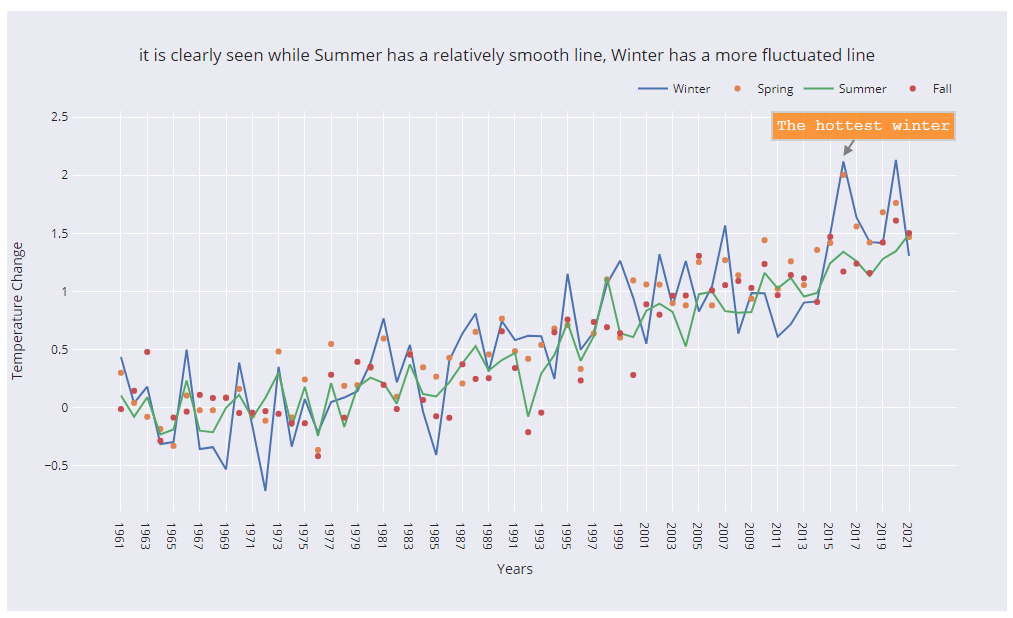
Seasonal Effects (Line Chart)
Examine the seasonal effects of climate change besides the yearly trend
Yearly Trend (Radar Chart)
Examine the seasonal effects of climate change besides the yearly trend

Conclusion
We examined how global surface temperature change between 1961 and 2021. When examining the top ten areas that have the highest temperature change in the last decade are mostly industrialized countries. Additionally, We found that temperature increased every ten decades, and the last decade can count as the hottest decade. From our above analysis result, We came up winter season getting more hotter. Finally, We tried to show how temperature is increasing worldwide as a proof of global warming. we analyzed deeper climate change effects in animation map; this shows how climate change gets serious year by year.
Other Information
The idea of this applicaton is taken from Kaggle Climate Change Project
Thanks
Made with
Version
1.0.015 Jul, 2022
Ideas portal
Category
Works with
InterSystems IRIS for HealthFirst published
09 Jul, 2022Last edited
15 Jul, 2022Last checked by moderator
20 Jan, 2026Works