© 2026 InterSystems Corporation, Cambridge, MA. All rights reserved.Privacy & TermsGuaranteeSection 508Contest Terms

REST Business Activity Monitoring  Awaiting Review

3
1 reviews
0
Awards
348
Views
0
IPM installs
 0
0 0
0
Details
Releases (3)
Reviews (1)
Issues
Articles (2)
Send IRIS Business Metrics to a REST Endpoint, or host a REST API to retrieve Business Metric values
What's new in this version
updated Short description
REST Business Activity Monitoring
This code extends on the Business Activity Monitoring features natively available with InterSystems IRIS’s integration framework.
![]()
![]()
Features:
-
Capture and push (using HTTP POST) business metric values to a nominated REST endpoint.
This is useful if you want to capture metrics and update a remote system. For example – using this feature one can push the metric values to a Power BI Streaming dataset which can be then consumed by Microsoft Power BI Dashboards for real-time visualization in that framework.Note that IRIS also has the capability to consume and display Business Metrics natively in HTML dashboards, and has a wider range of graphical widgets to choose from (see: IRIS Business Activity Monitoring).
-
Setup a REST API as an endpoint for external systems to call in and retrieve the list of business metric classes running in a production, as well as the metric values of a one or all enabled Business Metric Classes
It is worth mentioning that this functionality is accomplished without needing to modify, subclass or otherwise extend any existing Business Metric class code you have. This functionality taps into the tables currently defined by IRIS, that hold the most recent calculated metric values.
It is possible to import the entire package and implement both options offered here.
Installation:
- Clone or download/extract the REST-BusinessActivityMonitoring repository into an empty temporary folder on your system
- Open an InterSystems IRIS Terminal Window
- Switch into a Namespace configured for interoperability.
- Import the code into your namespace by executing execute the following command, where is the folder containing extracted repository.(Note this imports the entire package) :
do $System.OBJ.LoadDir(<yourTempDir>,”ck”,,1)
Note: this method imports all functionality, including the Sample Production and Sample Metric class. You may remove the classes not required (eg zaux.rBAM.Sample*). Please refer to the Installation section of the included documentation to identify which classes to retain.
Example use case - Building Power BI Dashboard from IRIS Metric Data:
This example will utilise the provided Sample Production and MetricClass to get going.
-
Import code and setup the sample production.
Once installed, open and view the production zaux.rBAM.Sample.Production. Do not start the production yet. -
Setup the Microsoft Power BI Streaming Dataset
-
With your Workspace selected, refer to the top right-hand drop menu + Create, and select Create -> Streaming Dataset
-
Select { API } to define a generic streaming dataset, then click NEXT.
-
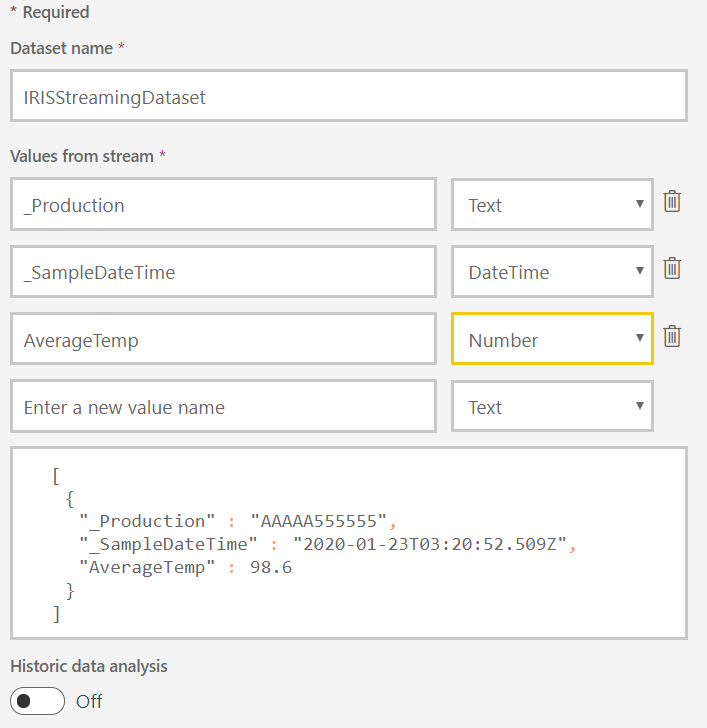
Give your dataset a name (eg: ‘IRISStreamingDataset’), and add the values:
 _Production		as Text
 _SampleDateTime	as DateTime
 AverageTemp		as Number **
** ‘AverageTemp is the only metric we are going to publish from the IRIS production.
Below is an illustration of what you should have at the end of this step:
-
-
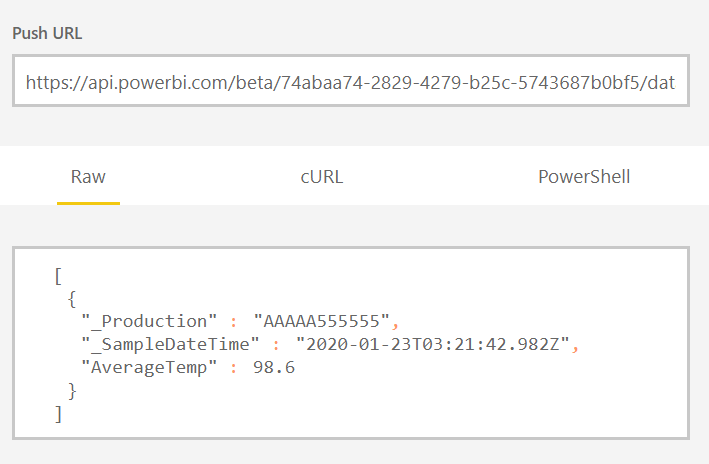
Record Streaming Dataset Push URL
- Once created, Power BI will determine and provide a URL to use to supply data. In this case that will be done by IRIS.
- Copy the contents of this long URL.
Below is an illustration of what you should have at the end of this step:
-
Back in the IRIS production, configure the IRIS Business Operation
Some zaux.rBAM.Operation settings need to be entered. (Most of the settings that are needed for formattin the JSON body for the Microsoft Streaming Dataset (eg StructuredOutput=0), have already been set for you). (Refer to the documentation for the meaning of each configurable setting).- Change the following settings
| Settings | Content |
|---|---|
| HTTP Server, HTTP Port and URL | Set these by using the URL provided my Microsoft in the previous step. |
| SSL Certificate | A certificate used to adopy SSL when sending data over REST. |
-
Startup the zaux.rBAM.Production production. Random metric values generated by the metric class will be collected
and pushed to the URL Provided. -
Build the Dashboard
- Go to your Microsoft Power BI account: powerbi.microsoft.com
- Within your Workspace, Create -> Dashboard
- Provide a name for the Dashboard (eg “IRISMetricsDashboard”)
- From the toolbar, select the elipse (…) and the option Add Tile
- Select Custom Creatming Data
- Your Streaming Dataset ‘IRISStreamingDataset’ should be listed. Choose this as the data feed.
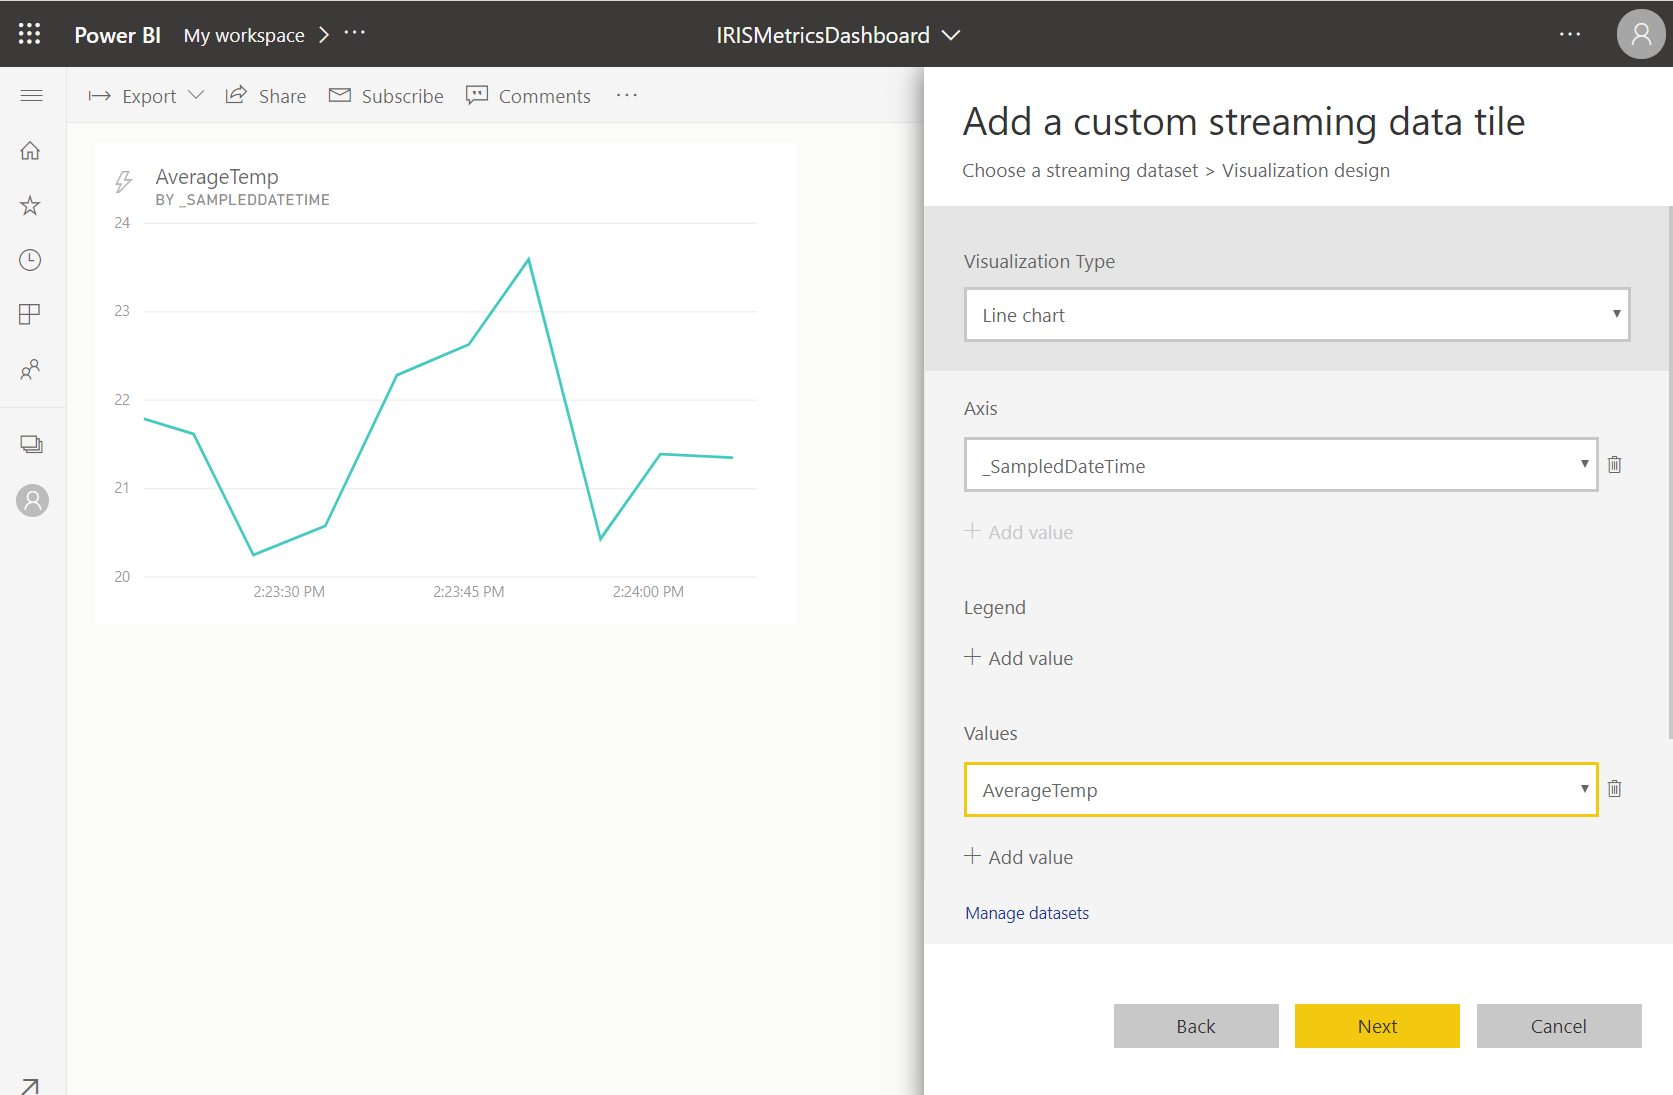
- On your tile, select your visualisation type as Line Chart
- For Axis, select _SampledDateTime
- For Values, select AverageTemp, thus plotting Average Temperature metric values over sampled date/time
- Click Next to proceed and complete other values like Tile Title, Sub-title, etc.
-
The Power BI Dashboard tile should now be receiving data and plotting this on a line chart.
Below is an illustration of what you should have at the end of this final step:
Version
1.0.203 Feb, 2020
Ideas portal
ObjectScript quality test
 PassedView report
Category
Works with
InterSystems IRISInterSystems IRIS for HealthFirst published
31 Jan, 2020Last edited
03 Feb, 2020