© 2026 InterSystems Corporation, Cambridge, MA. All rights reserved.Privacy & TermsGuaranteeSection 508Contest Terms
DC Analytics  Works
Works
Works

4.5
2 reviews
0
Awards
757
Views
0
IPM installs
 0
0 0
0
Details
Releases (1)
Reviews (2)
Issues
Pull requests (1)
Articles (1)
InterSystems Developer Community analytics.
What's new in this version
Initial Release
DC Analytics
![]()
InterSystems Developer Community analytics.
Project made with InterSystems IRIS BI (DeepSee), Power BI and Logi Report Designer to visualize and analyze members, articles, questions, answers, views and other pieces of content and activity on InterSystems Developer Community. This project contains pre-configured IRIS and Atscale deployment in Docker containers and project files for BI systems . This project also deployed online and you can check it here:
See Live DC analytics
PowerBI Interactive Dashboard with connection to the Adaptive Analytics Instance
Instance of Adaptive Analytics powered by AtScale
Login: user
Password: userp@$$
Login: _SYSTEM
Password: SYS
How to run DC analytics on a personal laptop:
First, you need to clone this repository to your local machine. Below in the text we will use relative paths to files when describing what is where. We assume that you are already in the project’s root directory.
1. Starting IRIS
InterSystem IRIS stores all the data in this sample project/ So we need InterSystems IRIS up and running and persists data. Below we will take the vanila image of InterSystems IRIS and load Community analytics data. Open the terminal in the project directory and run:
$ docker-compose up -d iris
This procedure will take 10-15 minutes.
After build will complete, you may check the IRIS BI dashboards here:
http://localhost:53233/dsw/index.html#/DCANALYTICS
It will looks like that:

Standard login and password:
_system/SYS
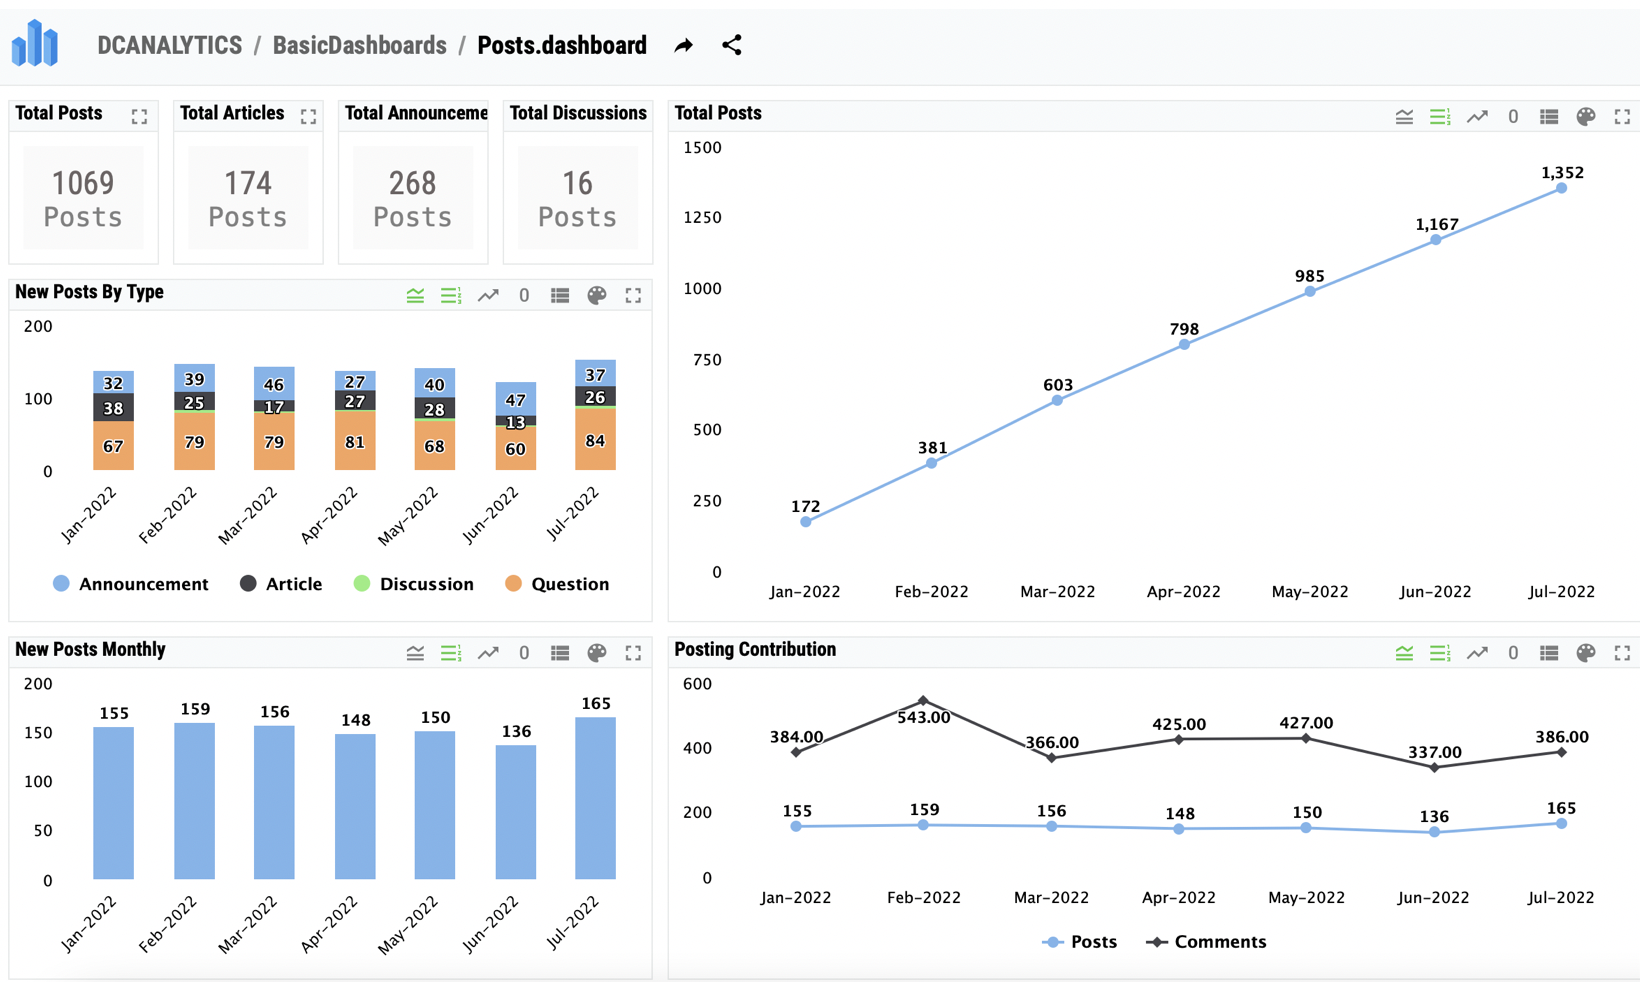
One of basic dashboards:
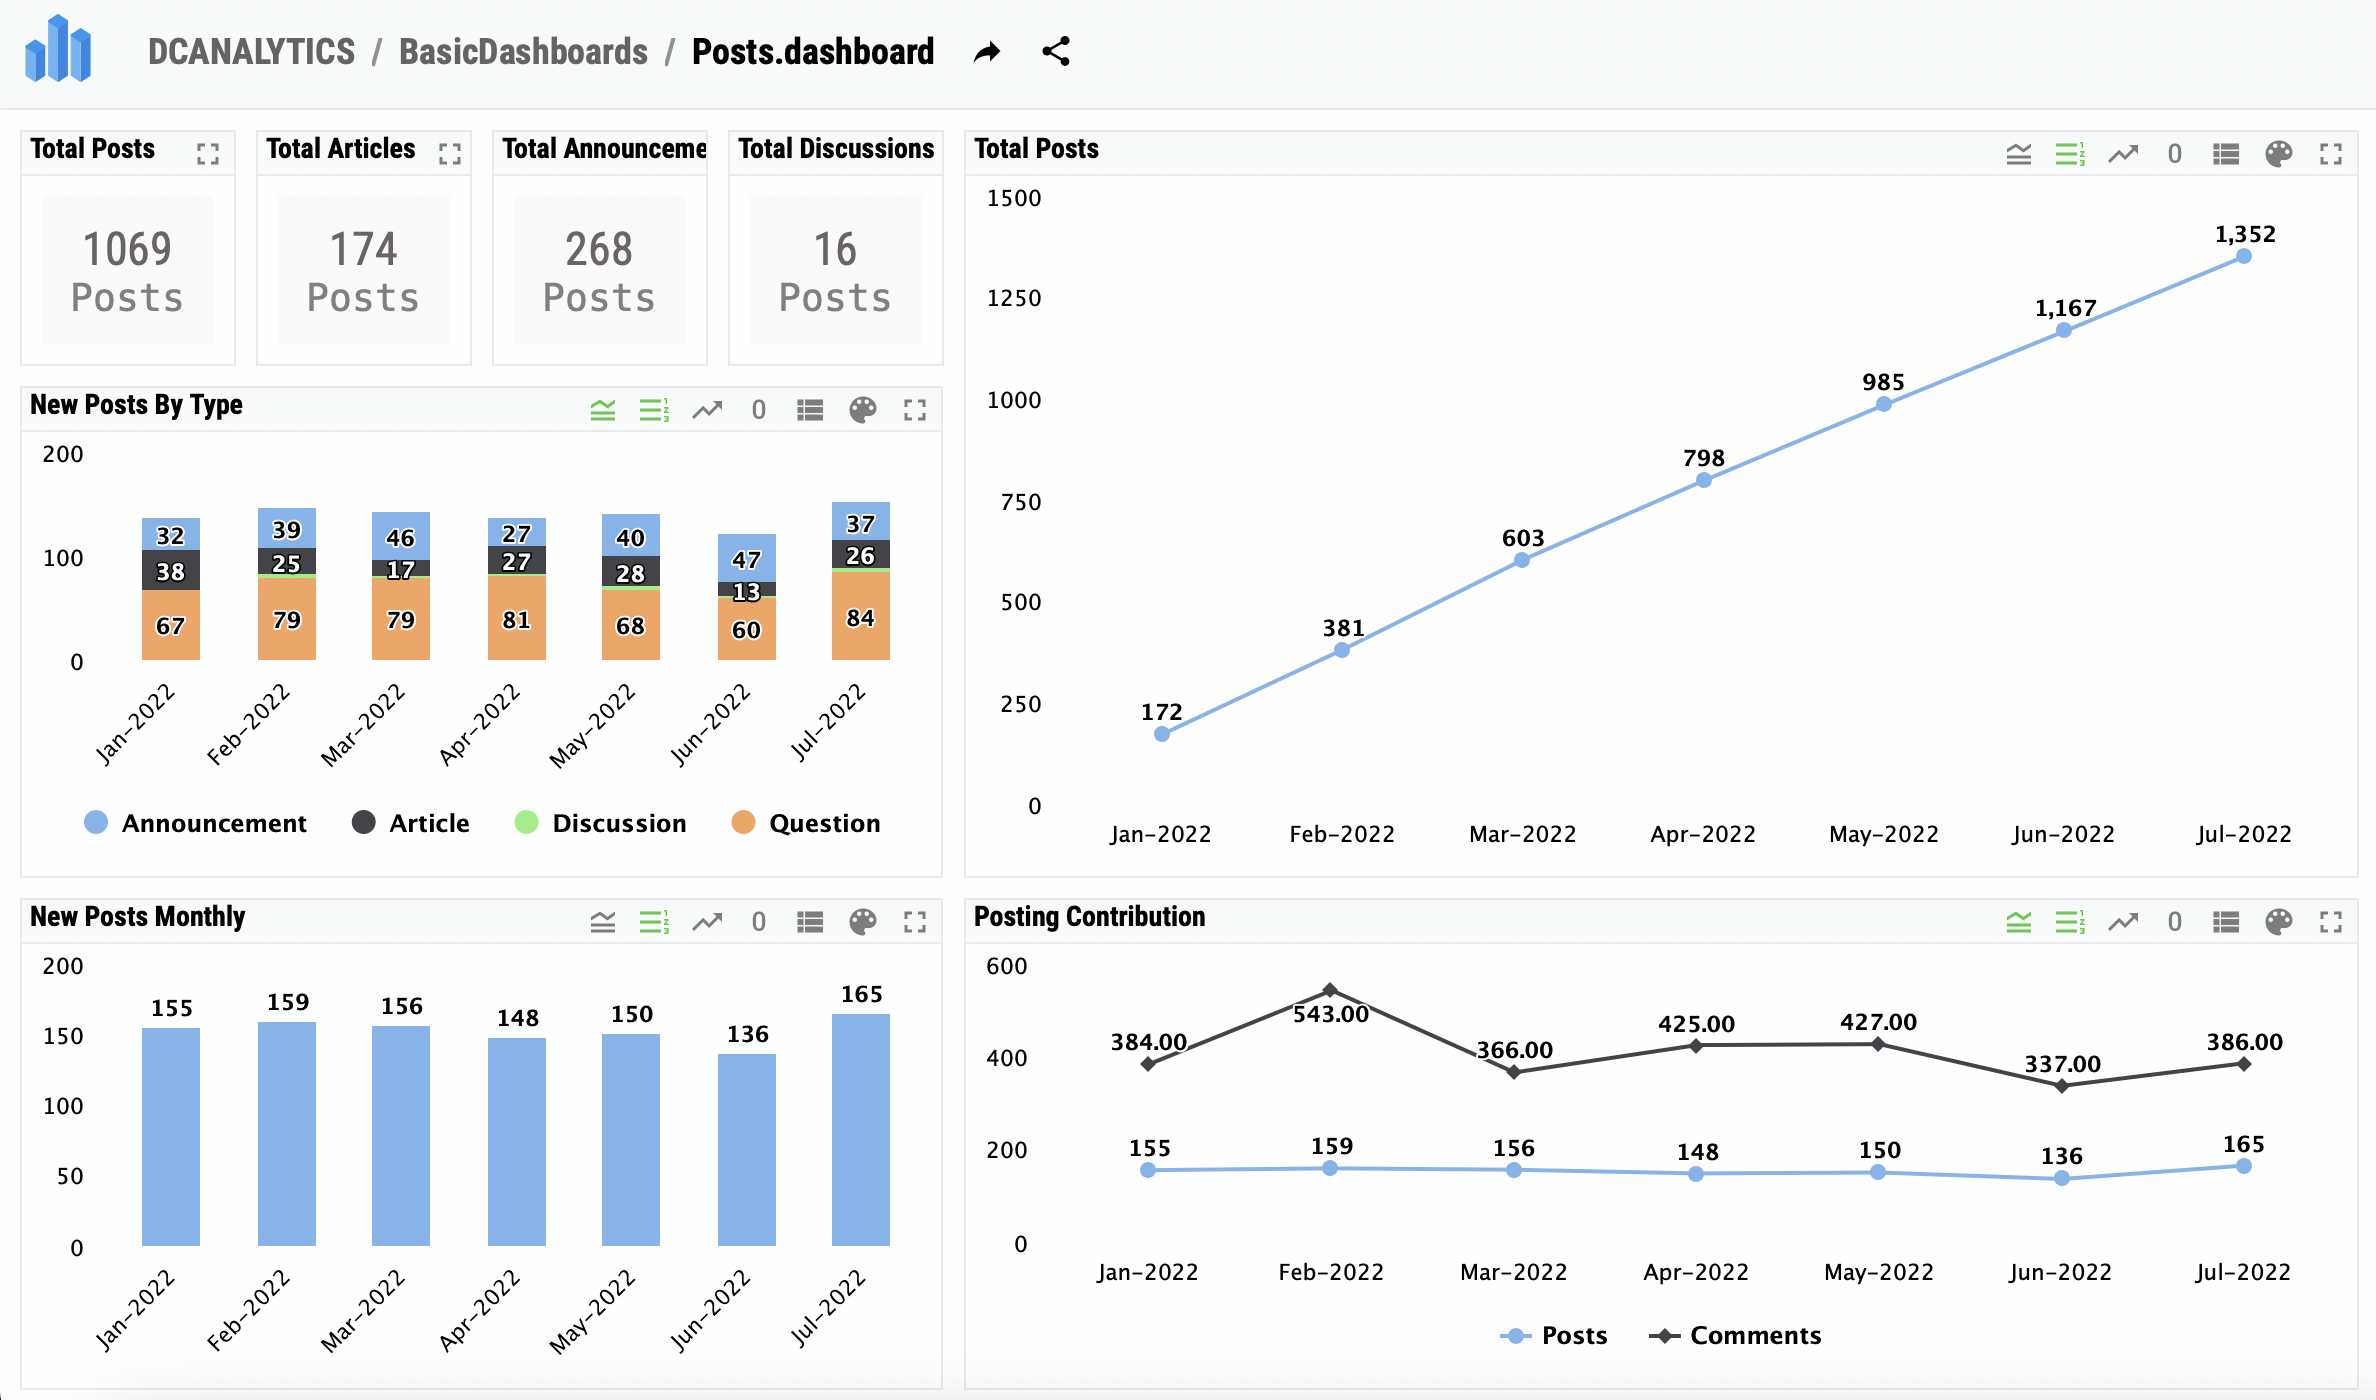
You can find the dashboard source files in the folder ”/iris/src/dfi”
In “BasicDashboards” folder you will find layout of widgets. Other folders contain widgets themselves.
2. To start an Atscale server:
A license must be provided to run Atscale server. To do this you need to put the json file with the license in the folder “atscale-server/src/license”.
#ToDo Add how to give a link by docker-compose having one license for several projects.
In case you plan to deploy this project to some server you might want to alter hostname parameter: open directory “atscale-server”, file “atscale.yaml” and edit (ip or dns name):
loadbalancer_dns_name: “127.0.0.1”
Authenticating to the InterSystems Container Registry(ICR)
This sample uses AtScale docker container in ICR. This is a gated registry, thus the access token will be requested which you can obtain being a current InterSystems customer.
To sign into the ICR, take the following steps:
Open https://containers.intersystems.com/ in your browser and sign in using your InterSystems credentials.
Retrieve your Docker login token, or the full login command.
In your Docker interface (for example, your PowerShell window or Linux command line), authenticate to the ICR using the provided credentials. You can do this by copying and pasting the full docker login command displayed, for example:
docker login -u="your_username" -p="provided_password" containers.intersystems.com
For security reasons, however, you may want to instead enter the command docker login containers.intersystems.com, then enter your username at the Username prompt and paste your password into the Password: prompt.
Note: If you are logged into another Docker registry, the docker login command may result in an error; log out of the other registry before logging into containers.intersystems.com.
Run docker container with the command:
docker-compose up -d atscale
This will take a few minutes to pull and build the container.
After successful build wait 2-3 minutes while server is starting up and check the availability of the service:
Standard login and password:
admin/admin
If in the first step of the initial AtScale setup wizard you asked to provide a license, this means you didn’t put the license in the “atscale-server/src/license” folder. Project deployment automation did not work, because it did not have access rights and you have pure AtScale in front of you. You can fix it in two ways:
- You may put the license file in “atscale-server/src/license” folder and run the following commands to recreate all volumes on AtScale restart/
docker-compose down -v
docker-compose up -d atscale
- You may select the license at the initialization interface and follow the initialization process described below. After that, you can use the command to start the process of automatically deploying the project.
docker exec public-intersystems-developer-community-analytics_atscale_1 /root/projects_deployment.sh
This web interface lets you create and edin AtScale BI cubes. You need to follow the initial AtScale setup wizard and choose the following options.
- you need to leave the default connection port
- leave the login and password admin / admin
- select an Embedded directory for storing data
These connection settings are stored in the BI projects settings.
If you want to modify AtScale cubes you can find them in the projects tab. When you finish editing cubes and want to save changes go to the export tab of the project and download the xml representation of your cube. Then you need to put this file in the “/atscale-server/src/cubes/” folder of the repository (file name doesn’t matter) and delete the existing xml file of the project. If you don’t delete the original file AtScale wouldn’t publish the updated project with the same name and id. At the next build a new version of the project will be automatically passed to AtScale and will be ready for use as a default project.
AtScale doesn’t provide public documentation. In order to obtain the documentation open http://localhost:10500/org/default/support and go to the Documentation tab. You will be redirected to https://documentation.atscale.com/ and will be able to view it. We recommend examining this chapter to work with existing projects.
Saving changes:
By default, all changes to the IRIS or Atscale projects are saved inside these systems.
To cancel all changes and return to the default settings, from the current directory, run the command:
docker-compose down -v
Warning! This will remove all created Iris and Atscale containers and any changes saved in them.
UDAF optimization
UDAF stands for USER Defined aggregate functions. AtScale uses it to build aggregates on a host database server in order to process analytics queries faster. This is a mandatory component to use AtScale effectively.
UDAF component must be installed into IRIS. It can be done manually (check the documentation) or by installing an UDAF package from IPM (InterSystems Package Manager).
IPM is a gated package registry thus will need a token to get the access. Token can be obtained on IPM site using yuor InterSystems credentials.

Open IRIS terminal and run:
zpm "repo -n registry -r -url https://pm.intersystems.com/ -token access_token"
zpm "install isc-udaf"
Next, you have to turn UDAF on in AtScale Data Warehouse settings:
Go to http://[your-atscale-server]:10500/org/default/settings/data-warehouses and set Custom Function Installation Mode to Custom Managed value.

UDAF gives AtScale 2 main advantages:
- the ability to store query cash (they call it Aggregate Tables), so that the next query, using aggregation on data, takes from the database already pre calculated results.
- the ability to use additional functions (actually User-Defined Aggregate Functions) and data processing algorithms that AtScale is forced to store in the data source.
They are stored in the database in a separate table and Adaptive Analytics can call them by name in auto generated queries. When AtScale can use these functions, the performance of analytics queries increases dramatically.
AtScale has an internal logic for updating aggregate tables, but it is much more convenient to control this process yourself.
You can configure updates on a per-cube basis in the web interface of AtScale and then use scripts from “iris/src/aggregate_tables_update_shedule_scripts” to export schedules and import to another instance, or use the exported schedule file as a backup. You will also find a script to set all cubes to the same update schedule if you do not want to configure each one individually.
3. Using BI projects
Using demo IRIS and AtScale.
In “analytic_dashboards” folder you can find BI projects that are configured for both local data source and deployed online demo.
The AtScale online demo is located at http://atscale-public.demo.https://github.com/intersystems-community/dc-analytics/blob/master/community.intersystems.com:10500/login. Login and password for it: user/userp@$$
Power BI
The option of creation and editing of Power BI dashboards is available only for Windows OS.
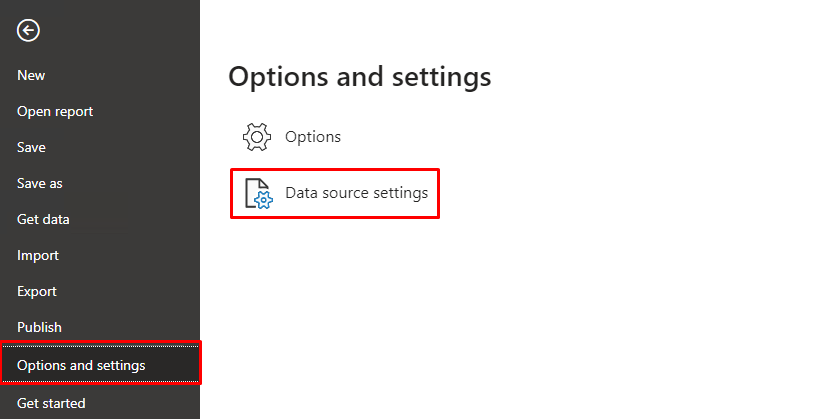
You may simply run the .pbix file from “analytic_dashboards\Power BI” in the Power BI desktop. Power BI stores BI data in this file, so when you open it for the first time it will show BI dashboards with data that was loaded by developers of this project. Click the refresh button to load the actual data into Power BI. Use the same credentials (admin/admin) as in the Adaptive Analytics (AtScale) with Simple Auth method (not Windows, but Basic tab of login window). You will need to provide login and password several times, or you may enter it in the settings. To do it, open the File tab of Power BI and go to Options and settings/Data source settings/Edit Permissions/Credentials and click Edit.

If you want to modify the Power BI dashboards you may check official beginner’s guide to learn the basics. We already prepare all the data, so you can start from build report step.
After you finish modifying the Power BI project and save it, the changes will be automatically stored in the Power BI file in the repository.
Tableau
Sample Dashboards made in Tableau Technology stored in “analytic_dashboards/Tableau/”
You will need Tableau Desktop application first to open files.
Another detailed Readme about Tableau in the Tableau folder.
Logi
You need a licensed copy of the Logi Report Designer to edit and run the reports. Also, you will need drivers for jdbc connection. You can find them here: https://github.com/teccod/Logi-JDBC-drivers. To use them you need to place lib folder in the root folder of Logi Report Designer’s installation directory.
You can obtain your copy of Logi Designer or Logi Server from WRC: Linux, MacOS and Windows
To get access to the WRC, the company must have paid technical support in InterSystems.
On the Start page of Logi Report Designer you need to click the Browse button in the Open category and select the path to the .cat file, then open a .cls file.
In “analytic_dashboards\logi report\En report” folder you may find the Сommunity monthly overview report - x pages report.
In “analytic_dashboards\logi report\members by community” folder you may find a simple report regarding the distribution of members by different language communities.
If you want to modify Logi reports you may be interested in official beginner’s guide to understand this BI system. If you only want quickly examine some data, you may be interested in explanation how to make a chart or a table. The beginner’s guide describes the process of creating a widget in a new report file. You can insert a chart or table into an existing report. You can do it from the Insert tab or Component window.

When you finish editing reports, you need to save the changes in the cls file, which is responsible for the visual part and in the cat file both, which is responsible for the structure and data processing.
Option: DC Posts views loading
You can use the command to build ViewsHistory cube to watch data in Views Dashboard.
You can run that command in the Iris Console:
do ##class(%DeepSee.Utils).%BuildCube("VIEWSHISTORY")
The cube with views of DC posts for IRIS BI takes a long time to build, so it is disabled by default.
There is the option to enable it for permanent.
To do this, you can change ViewsLoad variable in the iris.script
If it = “False”, then the VIEWSHISTORY cube is skipped to build.
Any other value of this string parameter will result in a 10 to 30 minutes build of large cubes, depending on the power of your PC.
Adding views allows you to view the data in that dashboard.

Collaboration
If you want to use this project on your onw IRIS installation, you may use the following instructions.
Installation
Basic
- First be sure, that you have MDX2JSON and DSW installed.
- Create new namespace with DCANALYTICS name.
- Enable DeepSee in namespace web-application settings.
- Download from release and import
DCAnalytics_classes*.xmlfile. - Download from release
DCAnalytics_globals.gzand run in terminal:
DCANALYTICS> do ##class(Community.Utils).setup("path/to/global/archive.gz file")
- Download from release
DSW.config.and.iKnow.files.zipand move filedcanalytics.jsonfrom archive to<your_instance>/CSP/dsw/configs/. The name ofdcanalytics.jsonshould match the name of the namespace. - Open in your browser
<server:port>/dsw/index.html?ns=DCANALYTICS. - Done
With iKnow
- Enable iKnow in namespace web-application settings. Be sure that everything listed above is installed.
- Download from release
DSW.config.and.iKnow.files.zipand move filessets.txtandbacklist.txtfrom archive to<your_instance>/Mgr/DCANALYTICS/. - Run in terminal:
DCANALYTICS> do ##class(Community.iKnow.Utils).setup()
DCANALYTICS> do ##class(Community.iKnow.Utils).update()
DCANALYTICS> do ##class(Community.Utils).UpdateСubes()
- Open iKnow dashboard:
<server:port>/dsw/index.html#!/d/iKnow.dashboard?ns=DCANALYTICS - Done
Made with
Version
1.0.006 Sep, 2022
Ideas portal
Category
Works with
InterSystems IRISInterSystems IRIS BIFirst published
06 Sep, 2022Last edited
06 Sep, 2022Last checked by moderator
20 Jan, 2026Works