Show free DB space as a DeepSee dashboard
Data Quality Scorecard with Detailed Dashboard
Sisense (https://www.sisense.com/)
Sample how to do CDC using IRIS, Postgresql, Kafka, Collumnar DB and BAM
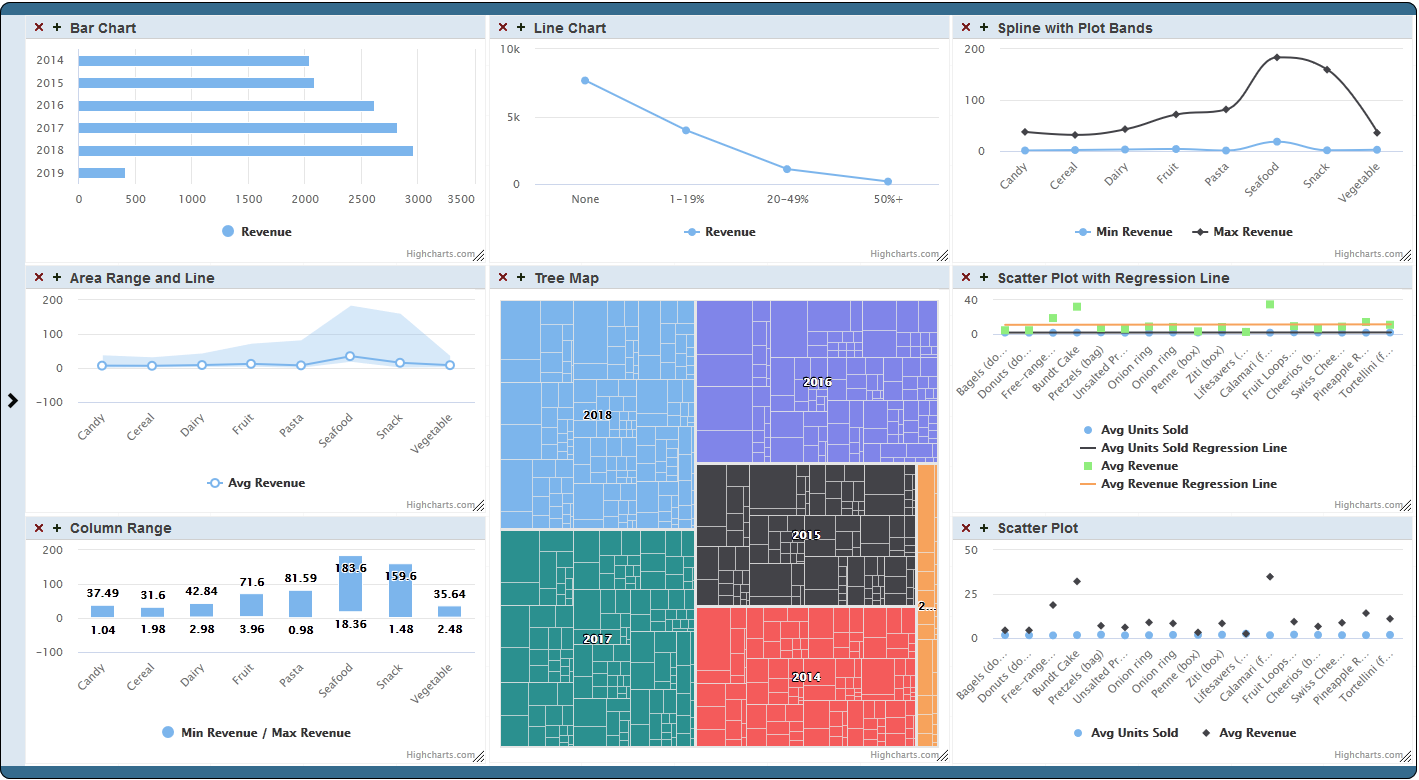
Use third-party charting libraries inside of Dashboards
analytics for covid-19
A simple example of generating machine learning prediction data
Showing the COVID-19 vaccination track count around the world and the COVID-19 Treatment and Vaccine development. Using as backend InterSystems IRIS in a multi-model schema.

 184
184  3
3 


 Filter
 Filter